
Figure 1. Effect of alcohol feeding on mouse liver.
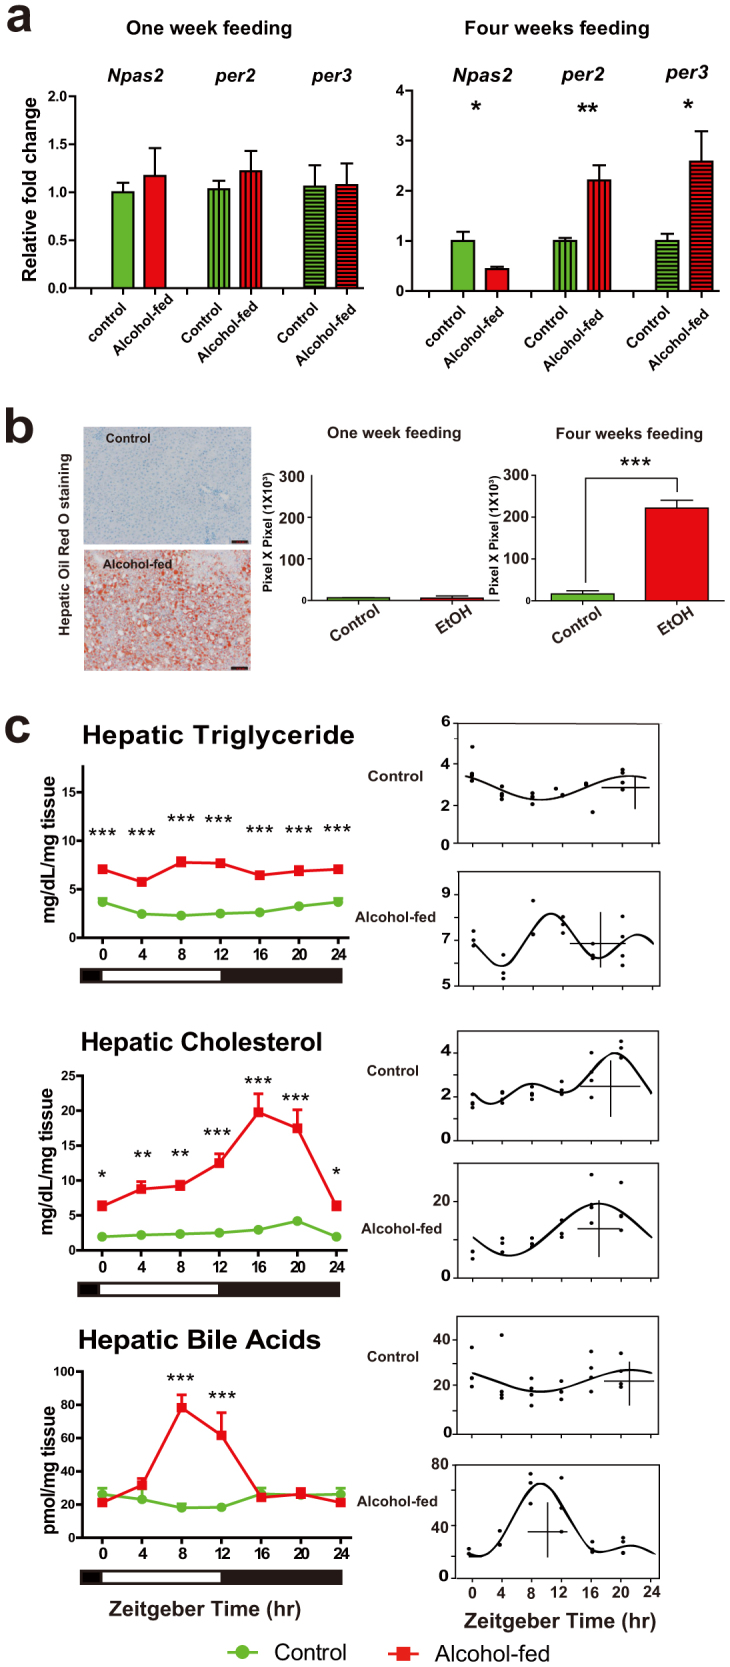
(a). qRT-PCR analysis of circadian clock gene expression from control and alcohol-fed mice. One-week (left) and 4-week feeding (right). Values are mean ± S.E.M., and where control group expression = 1.0. t tests (*p < 0.05, **p < 0.01). (b) Representative Oil Red O stained liver sections from control and alcohol-fed groups detecting neutral lipids (Left). Scale bars, 200 μm. Quantification values are mean ± S.E.M, n = 6 mice per group (right). t tests (***p < 0.001). (c) (Left) Hepatic lipid profiles (TG, CHOL, and TBA) in control (green line) and alcohol-fed (red) mice (n = 3–6 mice per time point) across 24-h cycle. Data from ZT0/24 are double-plotted. Two-way ANOVA performed followed by Tukey's post-hoc t tests (*p < 0.05, **p < 0.01, ***p < 0.001). (Right) Corresponding CircWave analysis of TG, CHOL and TBA in control and alcohol-fed mice. In the graph, each dot represents the level of compound for each animal in time-specific groups, the curve represents the best-fit fourier curve, the CG is represented by the vertical bar, and the mean of the entire data set is represented by the cross.