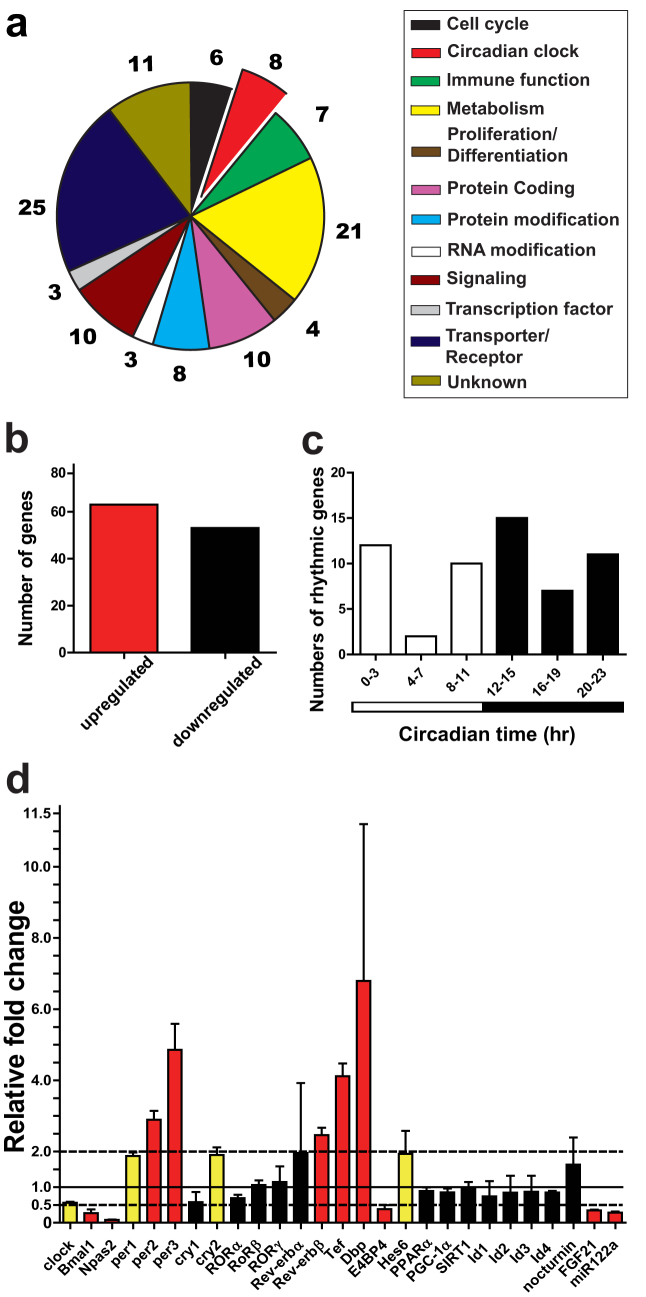
Figure 2. Microarray analysis of liver from alcohol-fed mice.
(a) Genes involved in multiple cellular processes were identified as differentially expressed in alcohol-fed mice liver. Genes shown were scored as differentially expressed by ≥ 2-fold change. (b) 63 and 53 genes identified as differentially expressed were up- and down-regulated, respectively. (c) Distribution of differentially expressed CCGs according to known peak phase (determined from published database51,52). (d) Fold-change of selected differentially expressed genes from microarray experiment. Data represents mean ± SD relative to mean of control gene expression ( = 1.0). Red bar, p < 0.05 and ≥ 2-fold change; yellow bar, p < 0.05 and ≥ 1.5 to < 2-fold change; and black bar, p > 0.05.

