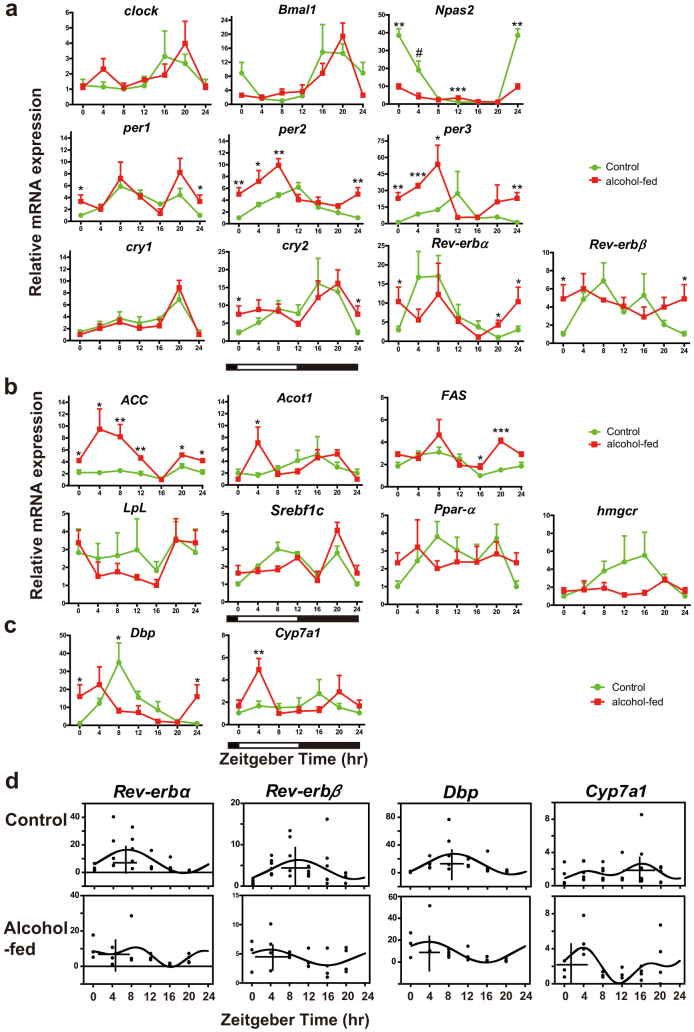
Figure 3. 24-h analysis of clock gene, CCG and metabolic gene expression reveals time-of-day specific differences between alcohol-fed and control mice.
(a) Clock gene expression in mouse liver. (b) Metabolism gene distribution in mouse liver. (c) Dbp and Cyp7a1 gene expression. (d) CircWave analysis of Rev-erbα, Rev-erbβ, Dbp and Cyp7a1 expression for control and alcohol-fed groups, showing CG. Values are mean ± S.E.M. expression relative to the lowest of time-specific mean value in entire series ( = 1.0; n = 3–6 mice per time point). Two-tailed Student's t tests (*p < 0.05, **p < 0.01, ***p < 0.001). For Npas2 at ZT4, a one-tailed test was performed, since it was identified as up-regulated in the microarray analysis (#, p < 0.05). Data from ZT0/24 are double-plotted.

