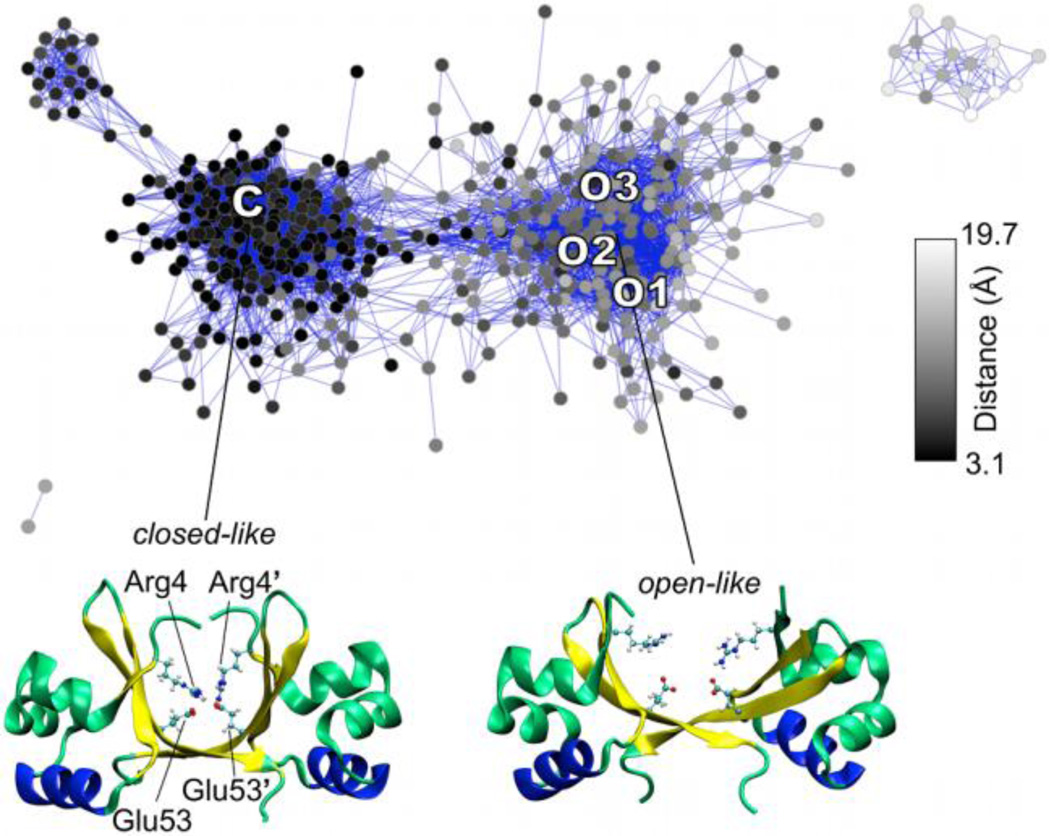
Figure 10.
Network constructed from REMD simulation of the lambda Cro dimer [31] with the closed (C) and open (O1, O2, and O3) X-ray structures indicated on the layout. Black and gray/white nodes denote conformations with shorter and longer distances between the Arg4 and Glu53’ intersubunit salt bridge residues, which are highlighted in the closed- and open-like structures shown below the network.

