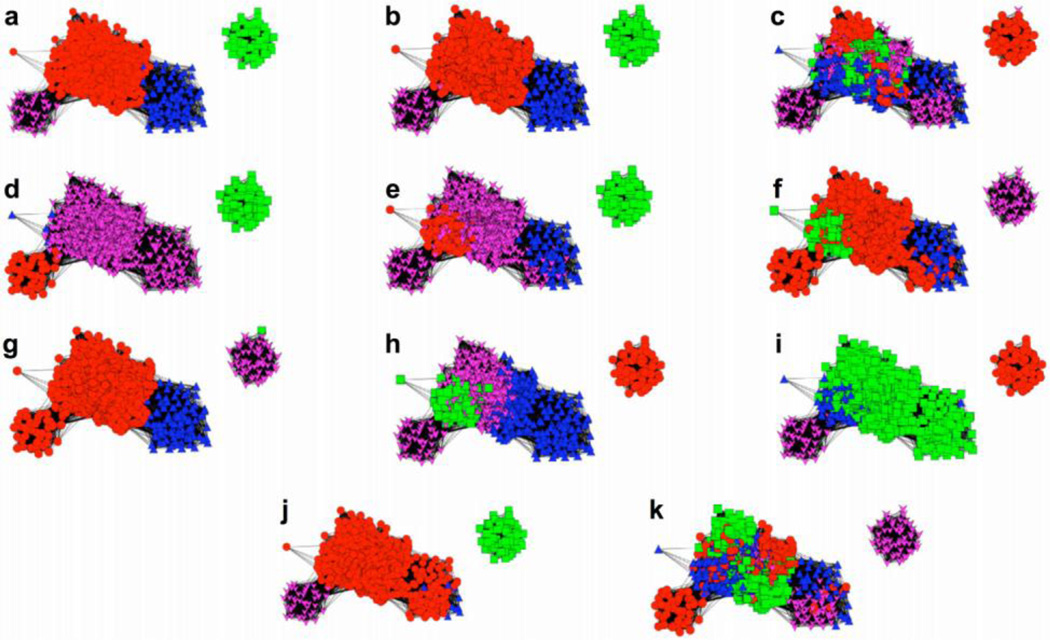
Figure 5.
Comparison of the results from 11 clustering algorithms with a network constructed using 1000 frames from MD simulation and the force-directed layout algorithm: (a) FAG-EC, (b) average linkage, (c) Bayesian, (d) centripetal, (e) centripetal complete, (f) complete linkage, (g) edge, (h) hierarchical, (i) k-means, (j), single linkage, and (k) SOM. A threshold parameter of one and a minimum complex size of two were used for the FAG-EC algorithm.

