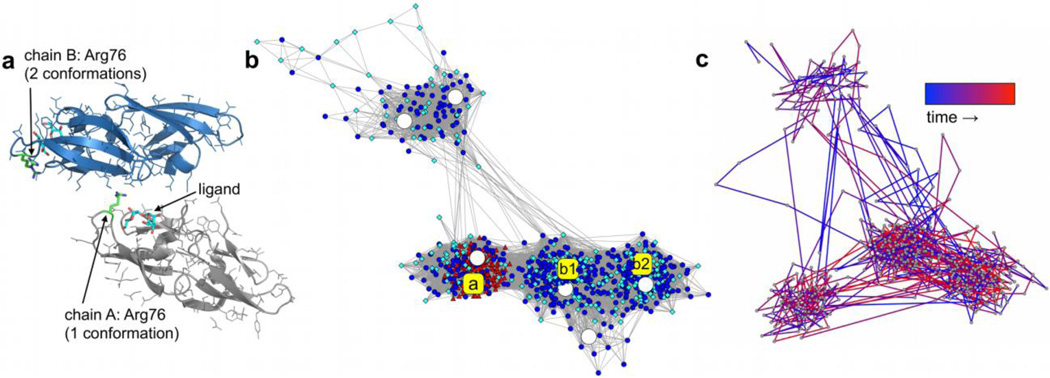
Figure 7.
(a) Packing interface in the crystal of the CVN:di-mannose complex (PDB: 2RDK [41]) involving chains A (gray) and B (blue) with Arg76 (green) and the di-mannose ligand (cyan) indicated in both chains. (b) Network constructed from snapshots of Arg76 from solution (circular blue nodes) and crystal MD (red triangles and cyan diamonds correspond to snapshots from chains A and B, respectively) as well as the X-ray conformations (a, b1, and b2; yellow squares) and six representative structures from average linkage clustering of the solution trajectory (large white circles). (c) Over-time transitions for 500 frames from solution simulation [34].

