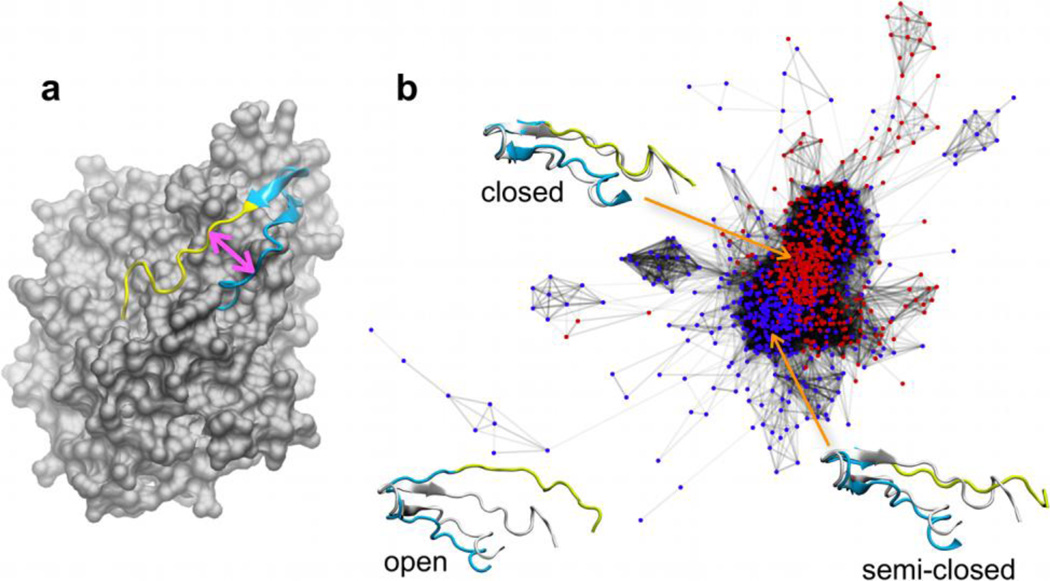
Figure 8.
(a) Location of the mobile loop in luciferase (gray) with the flavin-distal region (cyan) and the flavin-proximal region (yellow) indicated. The space between these two regions (pink double-headed arrow) is used to denote closed and open loop conformations. (b) Network constructed with snapshots from the ligand-bound (red nodes) and ligand-free (blue nodes) REMD trajectories [33], with closed, semi-closed, and open representative loop structures from k-means clustering shown against to the closed complex (gray) from panel (a).

