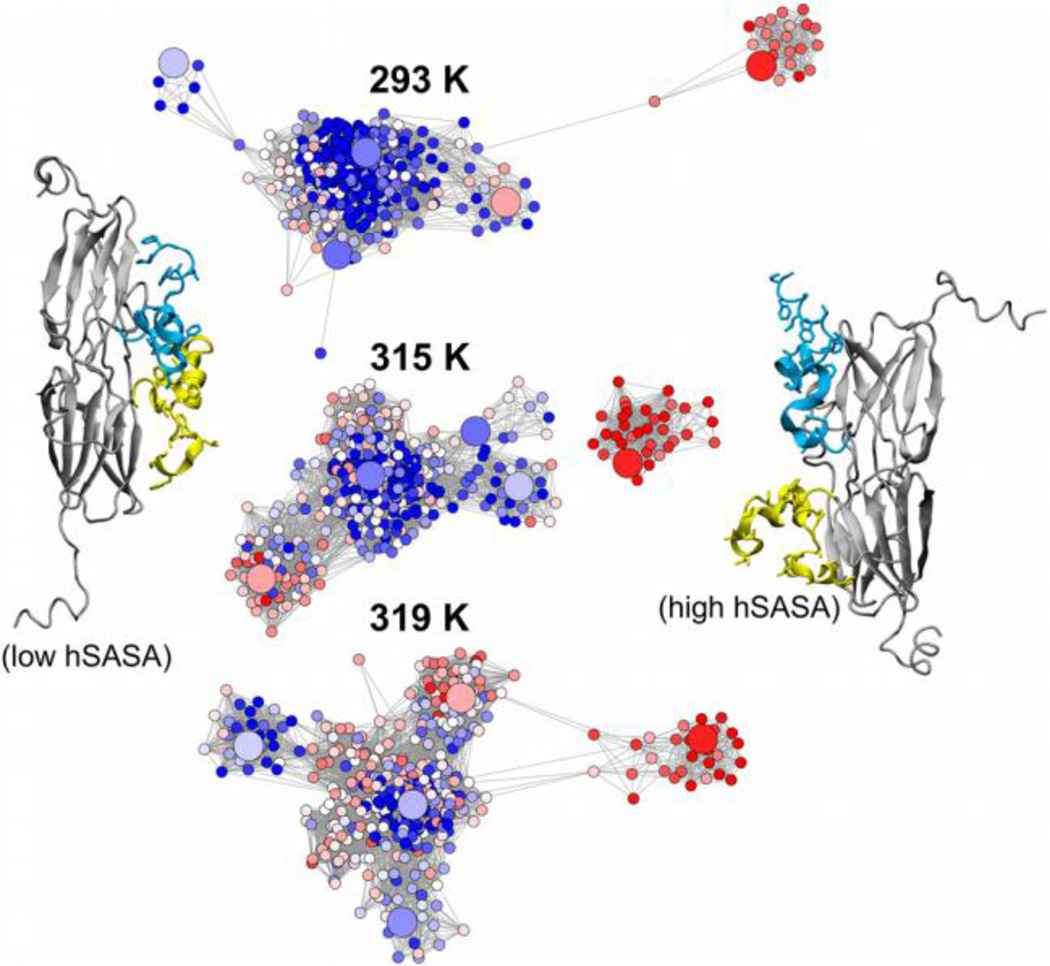
Figure 9.
Networks reporting on the conformational sampling of the Ta16.9 sHSP dimer N-terminal arms (cyan and yellow in the cartoon representations) at 293, 315, and 319 K during REMD simulation. Nodes are colored by the hSASA of the arms, which ranges from ~1400 Å2 to 3100 Å2 (blue, white, and red nodes correspond to low, medium, and high values of hSASA, respectively) and larger nodes denote representative structures from average linkage clustering. N-terminal arm conformations with low and high hSASA values are depicted to the left and right of the networks, respectively.

