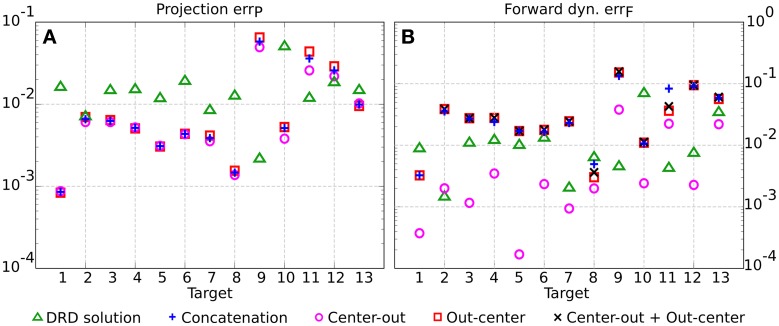
Figure 4.
Comparison between the DRD solutions to the entire testing reversal tasks (green triangles) and the concatenation of DRD point-to-point solutions (blue crosses) in terms of projection (A) and forward dynamics errors (B). The plot also indicates the performance of the individual center-out (magenta circles) and out-center tasks (red squares), and the sum of their corresponding errors (black Xs).

