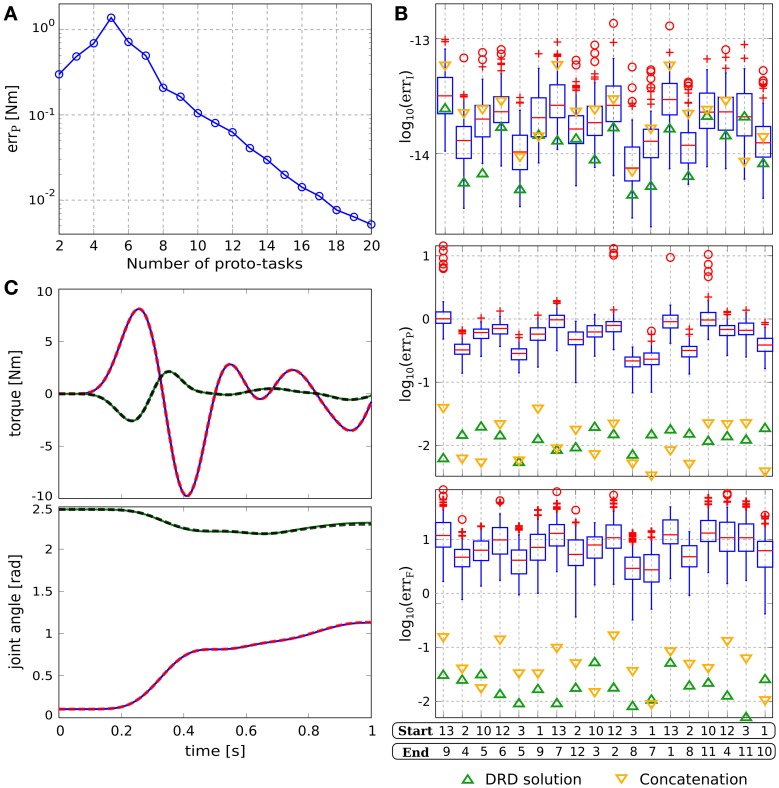
Figure 6.
Results of via-point reaching tasks. (A) Average projection error (across via-point reaching tasks with initial and final positions distributed in the workspace) as a function of the number of synergies. (B) Evaluation of the reduction phase for 18 testing via-point reaching tasks; “Start” and “End” indicate the indexes of the initial and final points, respectively (see Figure 1). The plots also present the errors obtained by concatenating individual out-center and center-out DRD solutions (yellow downward triangles). (C) Actuation that solves the task (continuous lines) and projected (dashed lines) torque, and interpolated (continuous lines) and executed (dashed lines) joint trajectories for the tasks with the highest projection error (i.e., Start 10, End 5).

