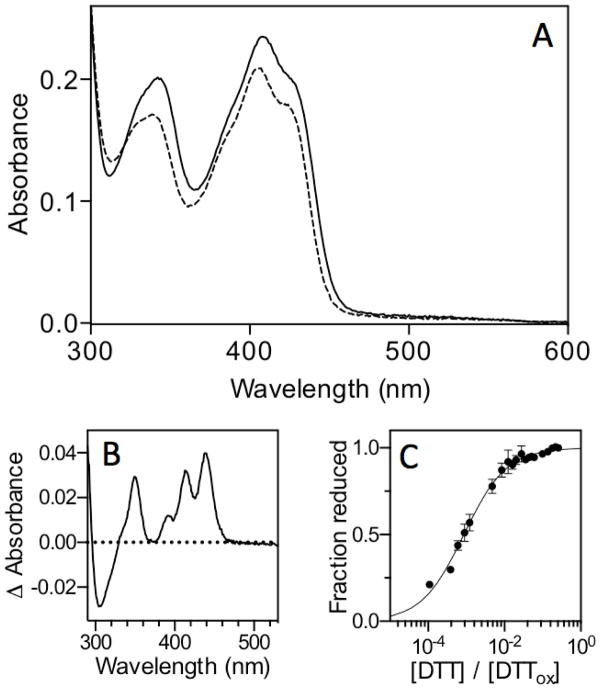
Figure 2.
Determination of the redox potential of the proximal disulfide in sfALR substituted with 5-deaza-FAD. Panel A shows the spectrum of 20 μM 5-deaza-FAD enzyme (see Experimental Procedures) in 50 mM phosphate buffer, pH 7.0, containining 1 mM EDTA recorded before and immediately after the addition of 5 mM DTT (solid and dashed lines respectively). Panel B shows the difference spectrum dominated at 439 nm by the blue shift in the leading edge of the oxidized 5-deazaflavin absorbance. Panel C follows the extent of these changes at 439 nm as a function of the redox poise of mixtures of reduced and oxidized DTT (see Experimental Procedures).

