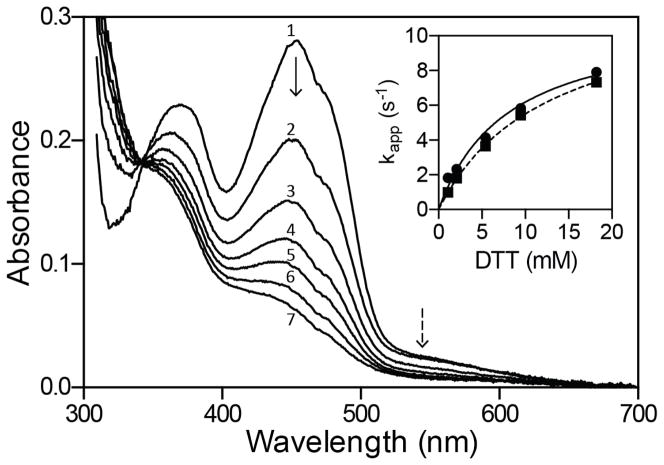
Figure 4.
Reduction of sfALR by DTT under anaerobic conditions. The main panel shows diode-array traces recorded 0.005, 0.145, 0.295, 0.445, 0.625, 0.845, and 1.405 s after mixing oxidized sfALR with DTT to give final concentrations of 30 μM and 5.4 mM respectively in 50 mM phosphate buffer, pH 7.5, containing 1 mM EDTA (spectra 1–7 respectively; see Experimental Procedures). The inset shows limiting apparent pseudo first-order rate constants of 12.4 ± 0.2 s−1 and 11.2 ± 0.8 s−1 for the reduction of FAD at 454 nm (solid line) and the disappearance of the charge-transfer intermediate at 550 nm (dashed line), respectively. Data are the average of triplicate runs.

