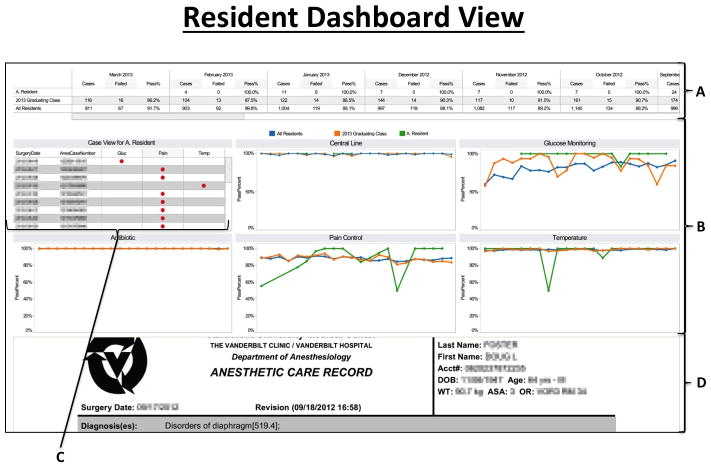
Figure 2.
This figure displays the Resident dashboard view which is accessed through a password-protected website. The different panels comprising this dashboard show: A) a tabular view of the performance of a single resident in comparison to CA training level and entire program by month, with ‘pass/fail’ as a binary score taking into account passing on all 5 metrics or not; case pass/fail rate; B) a graphical representation of the performance of single resident in comparison to CA level and entire program by individual metrics by month; C) individual case listings showing where resident performance failures occurred; and D) the PDF form of the case record in our AIMS can be accessed by clicking on one of the cases listed in panel C. [CA = Clinical Anesthesia; AIMS = Anesthesia Information Management System]

