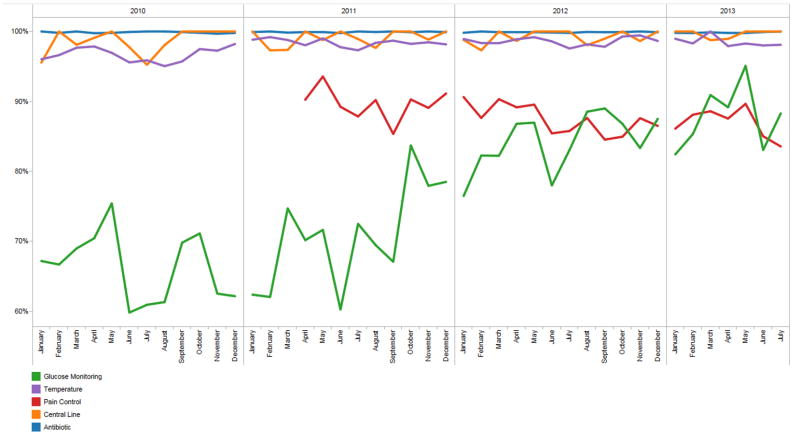
Figure 6.
This figure represents the overall programmatic performance on each of the five quality metrics over the study period and that most of the case failures are accounted for by the glucose monitoring and pain metrics. There is an observed improvement in glucose monitoring and temperature management over time, and the variability in central line documentation shows a reduction. Much of the improvement in glucose monitoring is likely due to decision support reminders embedded in our anesthesia information management system. Pain management does not appear to improve; however, our data shows that on average >90% of patients arrive to the PACU with a pain score <7. [PACU = post-anesthesia care unit]

