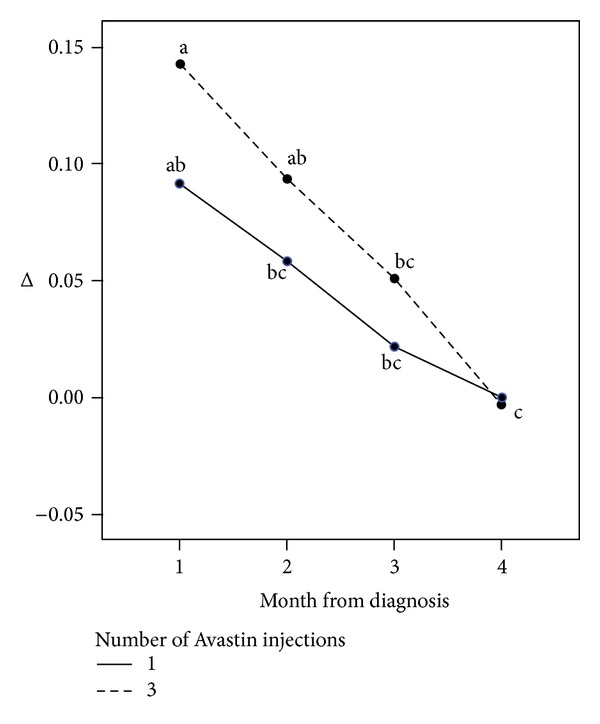
Figure 1.

Improvement of mean visual acuity according to time of first injection and number of injections. Different subscripts represent statistically significant differences between the groups (P < 0.001). The 2 statistically significant results are 3 injections starting within the first month (greatest improvement) and 1 or 3 injections starting after 3 months (worst result).
