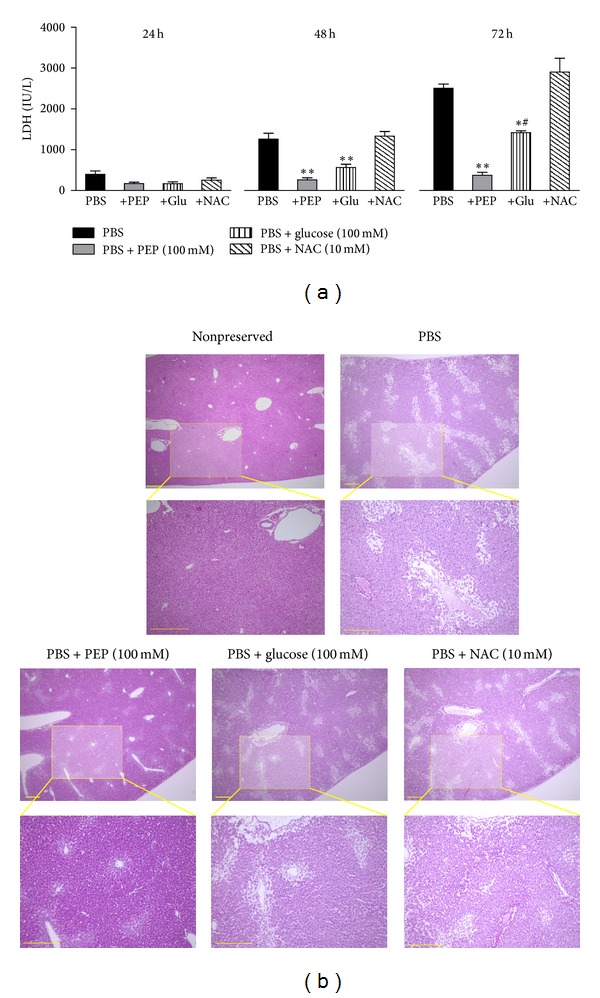
Figure 1.

Effects of PEP, glucose, or NAC on mouse liver damage during cold preservation. (a) Changes in LDH concentrations in the preservation solutions; PBS (n = 3), PBS + 100 mM PEP (n = 3), PBS + 100 mM glucose (n = 3), and PBS + 10 mM NAC (n = 3). Each bar represents the mean ± SEM. *P < 0.05 and **P < 0.01, compared with the PBS group. # P < 0.05, compared with the PBS + 100 mM PEP group. (b) Histological pictures of the liver 72 h after cold preservation. The liver tissues were fixed with 10% buffered formalin, embedded in paraffin, sectioned, and stained with hematoxylin-eosin. Nonpreserved fresh liver served as a control. Scale bar = 300 μm.
