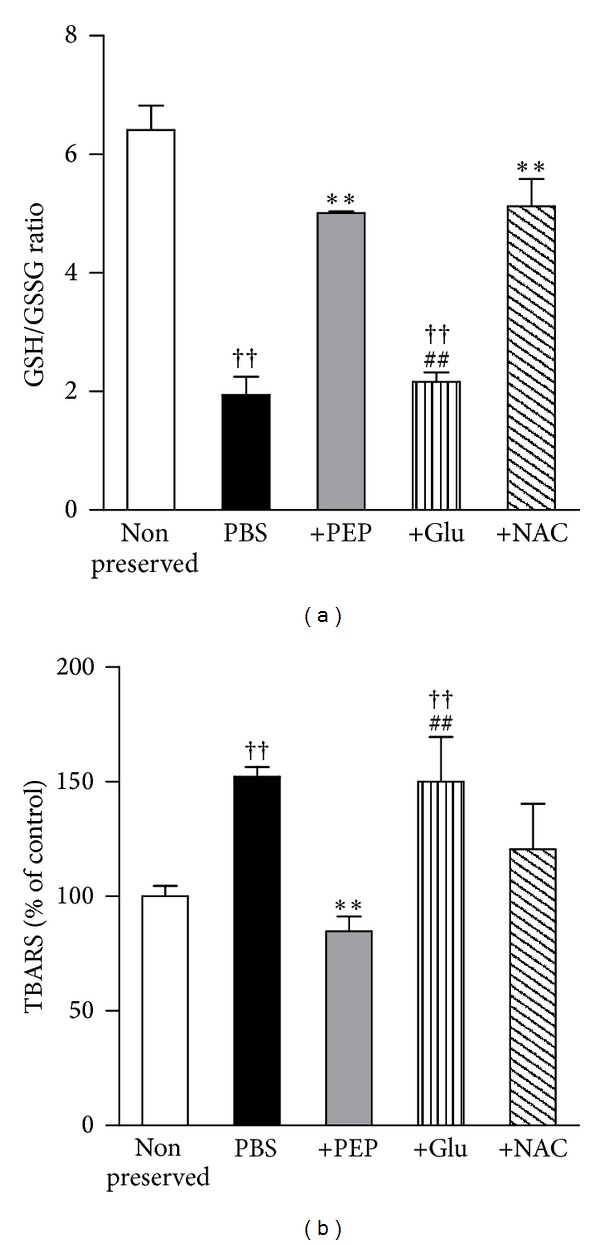
Figure 2.

Changes in oxidative stress parameters, (a) GSH/GSSG ratio and (b) TBARS, in cold-preserved mouse liver. The study group was divided into five groups as follows: nonpreserved fresh liver, as a control (n = 3), PBS (n = 3), PBS + 100 mM PEP (n = 3), PBS + 100 mM glucose (n = 3), and PBS + 10 mM NAC (n = 3). Seventy-four hours after storage, the liver tissues were homogenized and analyzed. Each bar represents the mean ± SEM. **P < 0.01, compared with the PBS group; †† P < 0.01, compared with the nonpreserved group; ## P < 0.01, compared with the PBS + 100 mM PEP group.
