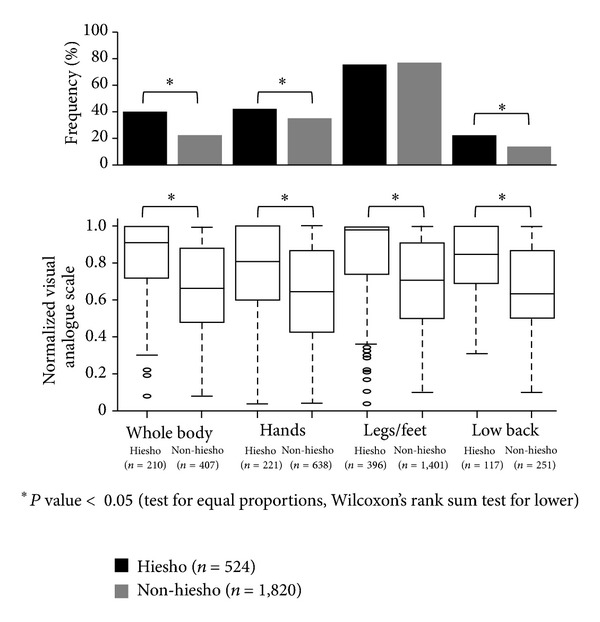
Figure 3.

Frequency and severity of hie (cold sensation) by affected areas. The frequencies of binary answers of four parts of the body where patients felt hie were significantly higher in hiesho group except for hie of legs/feet as per the test for equal proportions (upper figure). Normalized visual analogue scales of hie of each body part of hiesho group were compared to non-hiesho group by Wilcoxon's rank sum test. Hie in every part of the body was significantly worse in hiesho group (lower figure).
