
Fig. 4.
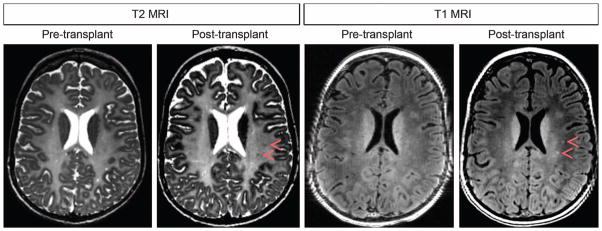
MRI images at baseline (pretransplant) and 12 months after transplant for subject 2. Small ovoid areas of T2 hypointensity and T1 hyperintensity (red arrowheads) were not present before transplantation and then gradually became visible after transplant. These areas do not represent small cysts because decreasing T2 hyperintensity is observed.