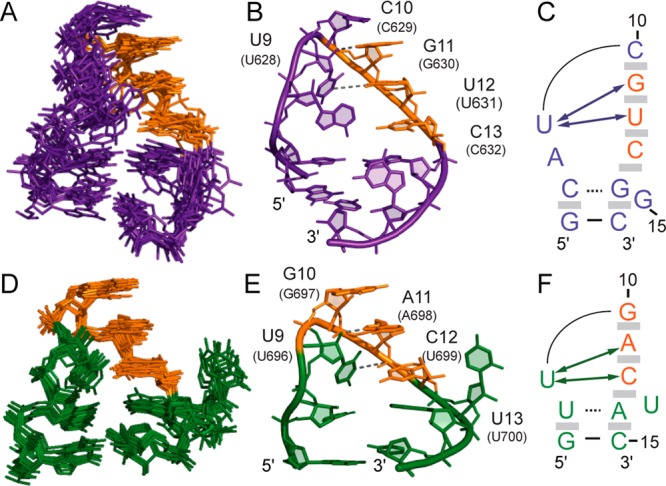
Figure 6.

U-turn structures in the SLIds2 and SLV loops of the SLIds2/SLV complex. Superposition of (A) the SLIds2 and (D) SLV loops of the 10 lowest-energy structures on the minimized average structure (not shown). Only heavy atoms of SLIds2 residues 6–16 or SLV residues 7–15 were used for the superposition and are shown. Minimized average structure of the (B) SLIds2 and (E) SLV loops showing base stacking after the sharp turn in the backbone, which is also represented by shaded gray boxes in (C) and (F). Dashed lines represent hydrogen bonds characteristic of a U-turn motif between U9I 2′–OH and G11I N7 and between U9I H3 and G11I 3′-phosphate in SLIds2 as well as between U9V 2′–OH and A11V N7 and between U9V H3 and A11V 3′-phosphate in SLV. Schematic representation of the (C) SLIds2 and (F) SLV loops in the complex. The arrows indicate observed NOEs that are characteristic of the U-turn motif, including those between U9I H1′/H2′ and G11I H8 and between U9I H1′ and U12I H6/H5 in SLIds2 and the equivalent NOEs in SLV.
