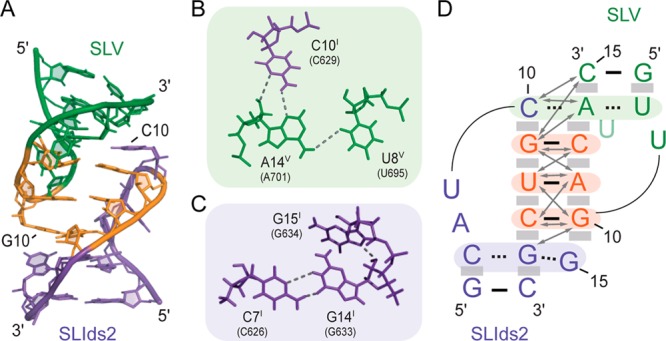
Figure 7.

Structural characteristics of the I/V kissing-loop junction. (A) Minimized average structure showing the kissing-loop interaction. (B)(C) Base triples in the minimized average structure. Dashed lines represent the following hydrogen bonds defined on the basis of short distances in the ensemble of structures (given in parentheses): A14V H61 and U8V O2 (2.85–4.88 Å), A14V N3 and C10I H41 (2.57–3.43 Å), A14V O2′ and C10I N3 (3.06–4.56 Å), C7I H41 and G14I O6 (1.70–2.74 Å), C7I N3 and G14I H1 (2.85–4.52 Å in 19 structures). (D) Schematic representation of the kissing-loop interaction between SLIds2 and SLV. The arrows indicate intermolecular NOEs observed between residues at the kissing-loop junction (Table S2 of the Supporting Information). Residues shaded in orange form Watson–Crick base pairs at the kissing-loop junction, those shaded in green and purple are involved in base triples, and shaded gray boxes illustrate base stacking. For clarity, U13V was drawn in a lighter green color.
