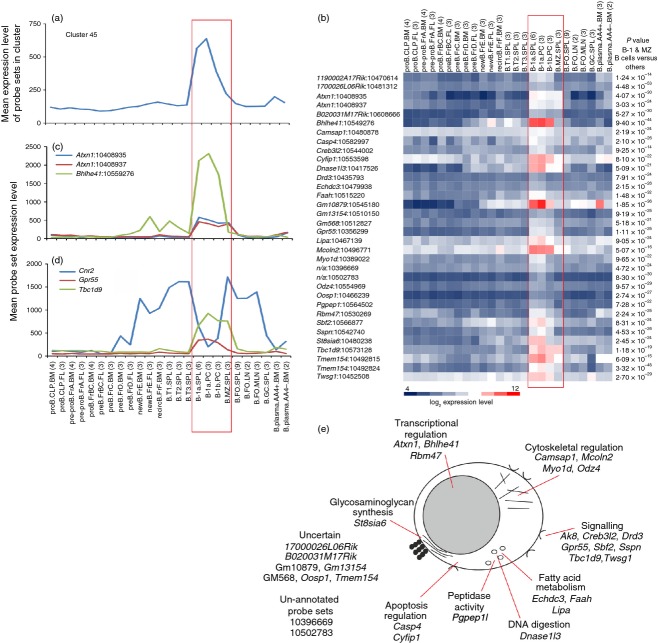
Figure 6.
Analysis of the genes within cluster 45 with expression enriched in B1 B cells and marginal zone (MZ) B cells. (a) The mean expression profile of all the probe set intensities within cluster 45 over the 84 samples. (b) Heat map showing the mean expression intensity of each probe set in cluster 45. Each column represents the mean (log2) probe set intensity for all samples from each source. Significant differences between groups were sought by analysis of variance. P-values for those genes that were expressed significantly (P < 0·05) by B1 B cells and MZ B cells at levels > 2·0-fold when compared with the other cell populations. (c) The mean expression profile of probe sets representing Atxn1 (blue and red) and Bhlhe41 (green) across the 84 samples. (d) Comparison of the mean expression profile of probe sets representing Cnr2 (blue), Gpr55 (red) and Tbc1d9 (green) across the 84 samples. (a–d) Samples are grouped according to cell type and are arranged in order of presentation as listed in Table S1. For each cell population mean expression levels are presented and the number of replicates is indicated in parenthesis on the x-axis. Red-boxed area indicates the B1 B-cell and MZ B-cell data sets. (e) Cartoon illustrating the putative functions of all the genes represented in cluster 45 in B1 B cells and MZ B cells.

