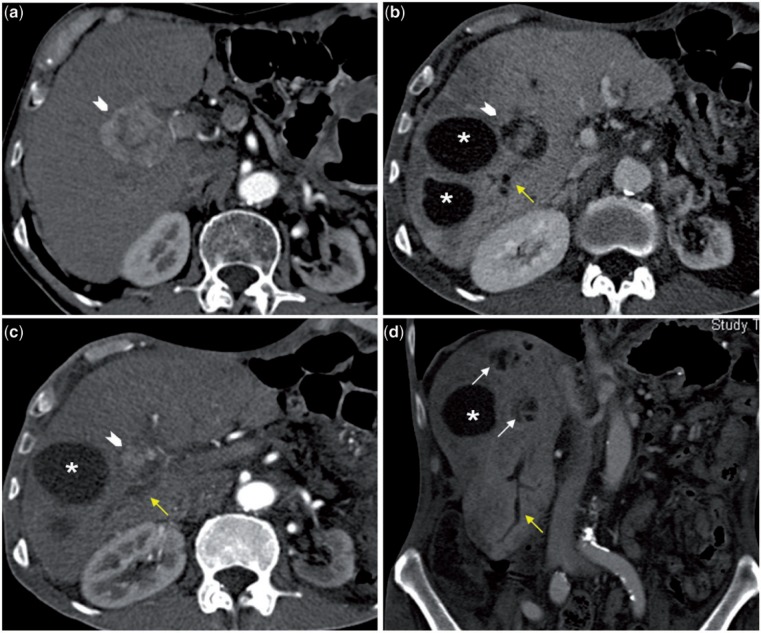
Figure 9.
This arterial phase CT scan (9a) shows a hypervascular tumor (arrowhead). Post-TARE arterial (9c) and portovenous (9b) phase CT scans show marked decrease in the size of the tumor with areas of necrosis around the residual tumor. The large, well-defined fluid-filled areas (asterisk) seen in 9b−d represent bilomas. The coronal image shows two clusters of smaller fluid density areas (white arrows); these represent foci of biliary necrosis that may coalesce to form a biloma. Also note the segmental biliary dilatation (yellow arrows) suggesting the presence of biliary strictures. Hepatic parenchyma appears heterogeneous in the portovenous phase with ill-defined geographic areas of hypodensity.

