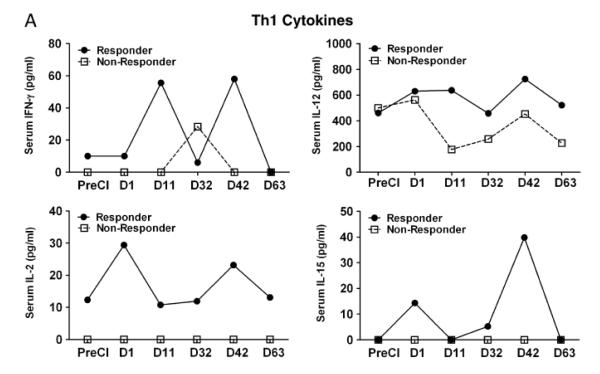
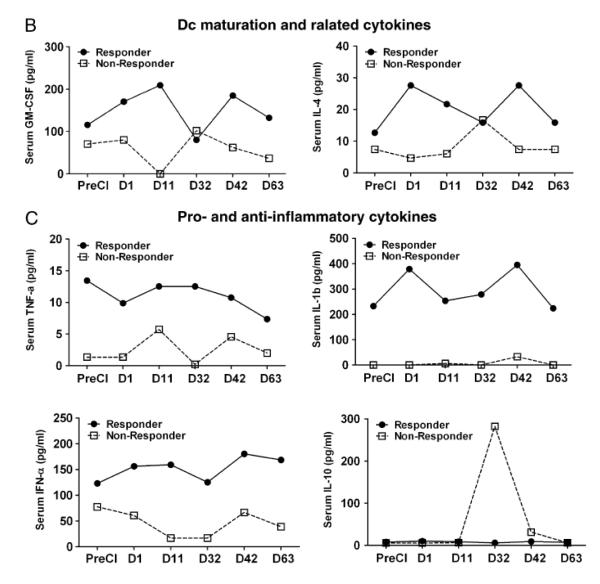
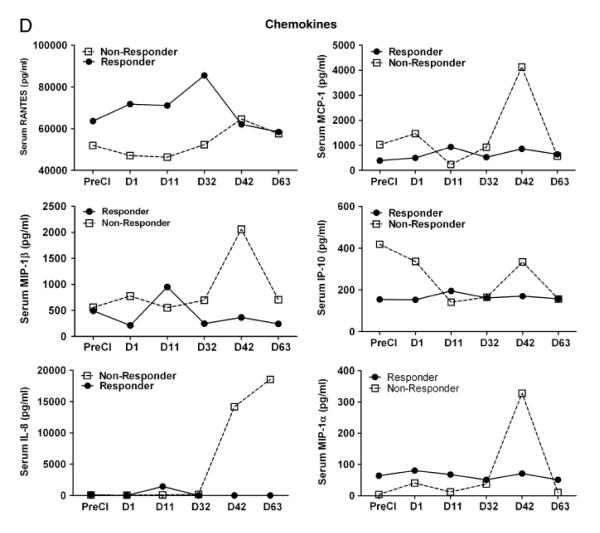
Figure 4. Cytokine/chemokine profile of patient serum.
A) Shows serum levels of cytokines, IFN-γ, IL-12, IL-2, IL-15, GM-CSF, and IL-4 at indicated time points postCI. For better visualization of the data, a different scale on the Y-axis was used for each cytokine in one responding patient and one non-responding patient. B) Shows serum levels of inflammatory cytokine TNF-α, IL-1β, IFN-α and immune suppressive cytokine IL-10. C) Shows the serum levels of chemokines RANTES, MIP-1a, MIP-1b, MCP-1, IP-10 and IL-8 in one responding patient and one non-responding patient.


