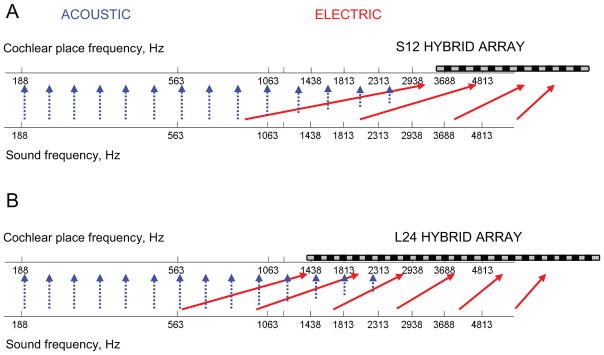
Figure 1.

Illustration of spectral discrepancies introduced by typical frequency-to-electrode allocations in the S12 10-mm, 10-electrode cochlear implant (A) and the L24 16-mm, 22-electrode cochlear implant (B). The lower axis shows sound frequencies before processing; the upper axis shows the frequencies that are stimulated in the cochlea, with a schematic of the electrode array superimposed. The solid red arrows show the mapping from processed sound frequency to electrically-stimulated cochlear place-frequency; most sound frequencies are delivered to electrodes at a higher cochlear place frequency. The blue dashed arrows show that in contrast, the low-frequency acoustic stimulation in both the implanted and the contralateral ear go to the approximately correct cochlear place, though the amplitude of the input that can be provided is gradually reduced at higher frequencies.
