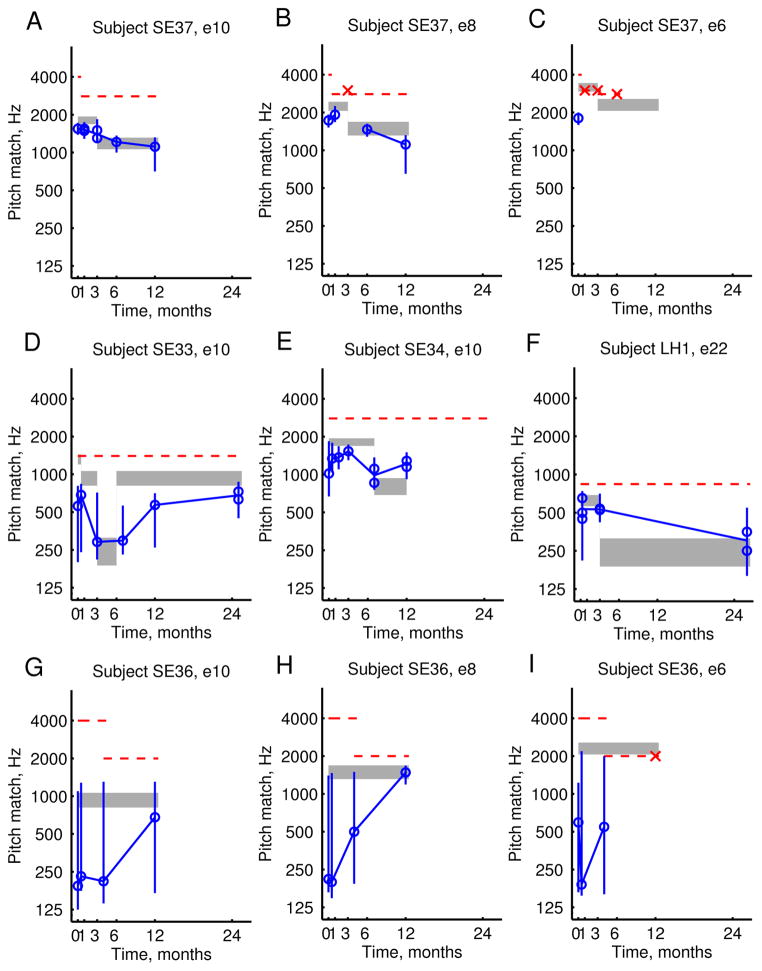
Figure 4.
Example pitch changes over time in three Hybrid subjects. Pitch match centers are shown as blue circles, the pitch match 25–75% ranges are shown as vertical lines, and the frequency allocations are shown as shaded gray bars. Horizontal red dashed lines indicate the upper frequency limit of the residual acoustic hearing in the contralateral ear, which were generally steady but occasionally lowered over time. A–C. Pitch changes that gradually followed frequency allocation changes for all electrodes in one subject, SE37. In particular, electrode 8 shows pitch changes that change direction with the direction of discrepancy with the frequency allocation (B). D–F. Large pitch changes were observed for the most apical electrode only in another subject, SE33, following a large frequency allocation change of more than 2 octaves (D). Again, reversals of pitch changes were observed for this electrode. G–I. Large pitch changes and changes in bandwidth of pitch percept were observed for another subject, SE36. In particular, electrode 8 showed a shift in pitch match center and the pitch match range has also narrowed to match the width of the frequency allocation.

