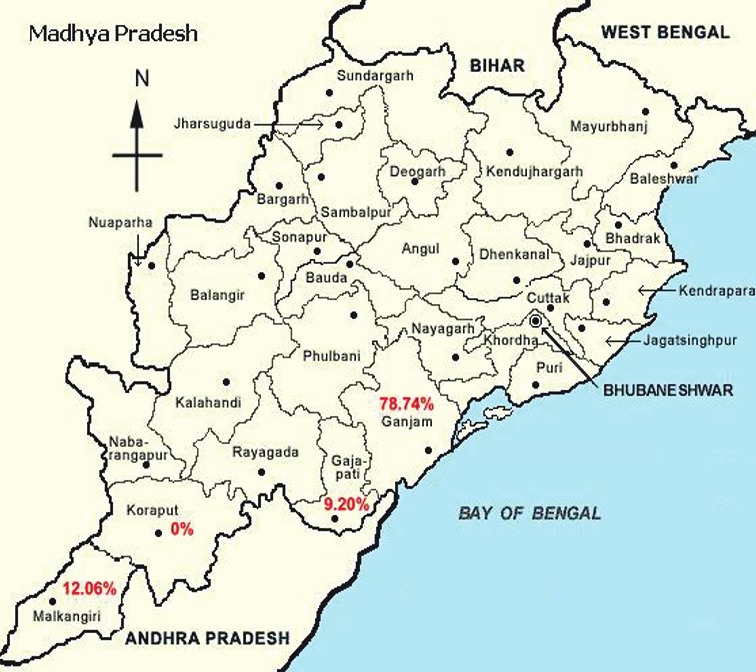
Figure 1.

Graphical representation of the districts from where samples were received for serodiagnosis of chikungunya showing the percentage of sero-positivity

Graphical representation of the districts from where samples were received for serodiagnosis of chikungunya showing the percentage of sero-positivity