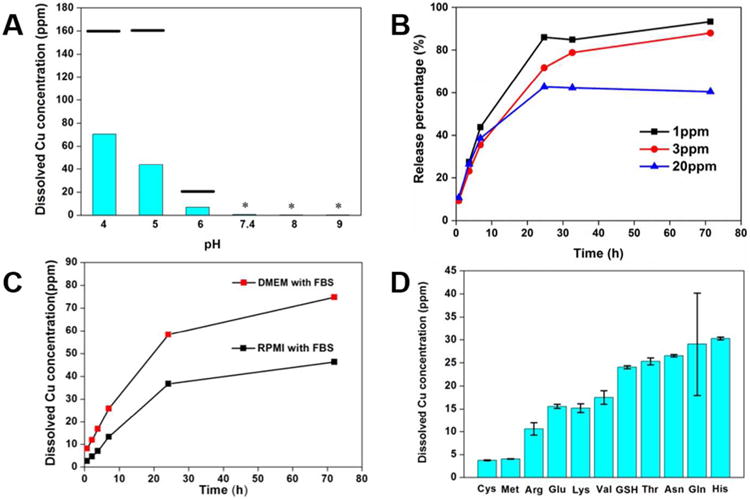
Figure 2.

Dissolution behavior of CuO in various fluid media. (A) Soluble copper produced by 24 hr incubation of CuO NPs (initial concentration 200 ppm) as a function of pH (50 mM acetate buffers at pH 4, 5 and 6, PBS buffer at pH 7.4 and 50 mM borate buffers at pH 8 and 9). The black bars indicated the equilibrium concentration in the corresponding pH conditions calculated by Visual MINTEQ 3.0, the stars indicated that both the calculated equilibrium concentration and real dissolved Cu concentration is close to the ICP-AES detection limit. (See Supporting Information for details) (B) Effect of initial CuO NP loading on dissolution kinetics (acetate buffer at pH 4.9) for 3 days expressed as percent of total copper. Over 80% of CuO was dissolved after 30 hours for 1 ppm initial loading of CuO NPs and then dissolved Cu concentration slowly increased. (C) Soluble copper produced by 3-day incubation of CuO NPs (initial concentration 200ppm) in DMEM and RPMI cell culture media supplemented with 10% FBS at pH 7.4. Note the much elevated Cu ion release relative to PBS buffer at pH 7.4 (panel A). (D) Ligand effects on CuO (initial concentration 200 ppm) dissolution using a series of amino acids and the tripeptide glutathione at 2 mM in PBS buffer. Please be noted that the dissolved copper measured is those that pass through the ultrafilters. Therefore, about cysteine, the dissolved copper concentration may be underestimated due to the formation of insoluble precipitate through copper-thiol bond.
