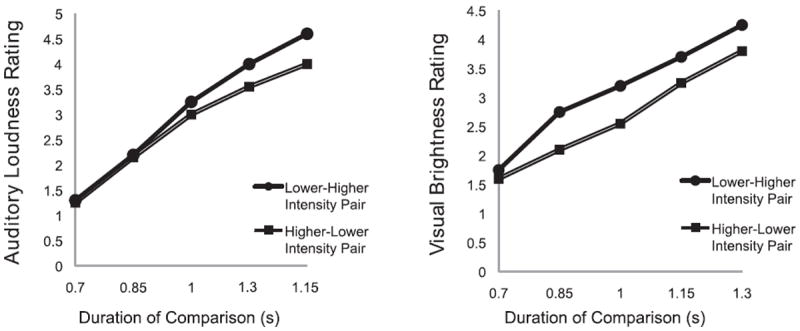
Figure 4.

Figures redrawn from Goldstone et al. (1978). Y-axis is the “average category response” rating, where 1 = “shorter” and 5 = “longer” than a 1-second standard duration. X-axis indicates the duration of the comparison value (in seconds). Higher/lower intensity in the figure legend refers to the order of brightness or loudness value presentation. High-Low pairs induce a bias to rate durations slightly lower, on average, than Low-High pairs. (Figure reproduced with permission from the Psychonomic Society.)
