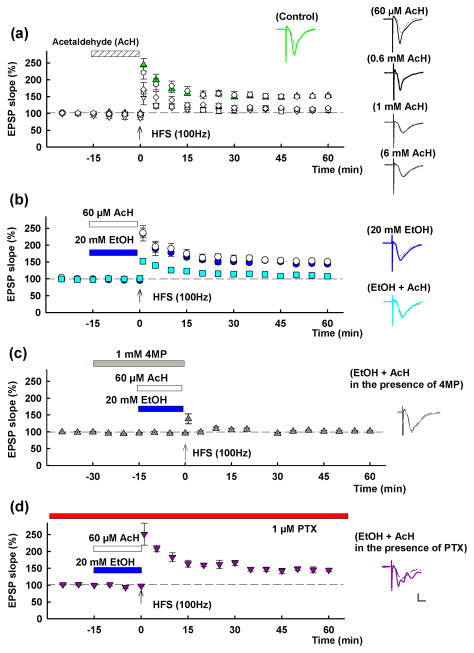
Figure 5.
Effects of acetaldehyde and ethanol on LTP induction. A, In control slices, LTP is readily induced (green triangles) by a single 100 Hz × 1 s high frequency stimulation (HFS, arrow). Fifteen min administration of acetaldehyde (AcH, hatched bar) at 0.6 mM (white diamonds), 1 mM (white squares) or 6 mM (white triangles) inhibits LTP. At 60 μM, acetaldehyde did not alter LTP induction (white circles). B, LTP is not blocked by 20 mM ethanol (EtOH) (blue bar, blue circles), but LTP is blocked by a combination of 60 μM acetaldehyde (white bar) plus 20 mM ethanol (aqua squares). White circles show effects of 60 μM acetaldehyde alone for comparison. C, The inhibition of LTP by 20 mM ethanol plus 60 μM acetaldehyde is overcome by continuous administration of 1 μM picrotoxin (PTX). Traces depict EPSPs before (dashed lines) and 60 min after HFS (solid lines). Solid lines in color match symbols in the graphs. Scale; 1mV, 5 msec.

