
Figure 5.
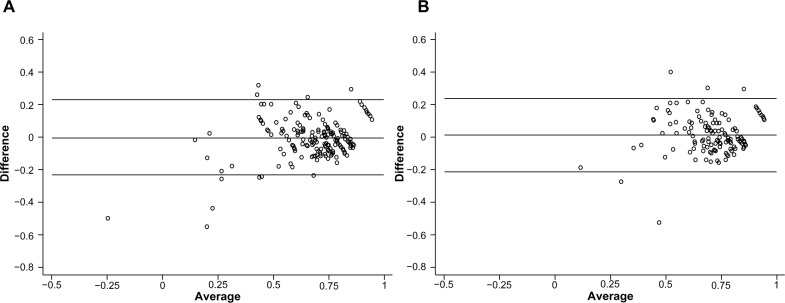
Bland–Altman plots of agreement between observed and predicted EQ-5D utility scores.
Notes: (A) Agreement in the estimation sample. (B) Agreement in the validation sample. The x-axis depicts the mean of the observed value and the predicted value, and the y-axis shows the difference (observed minus predicted). The lines show the mean difference, ie, the estimated bias, and the 95% limits of agreement (±1.96 SD of the mean difference).
Abbreviations: EQ-5D, EuroQol 5 Dimensions questionnaire; SD, standard deviation.