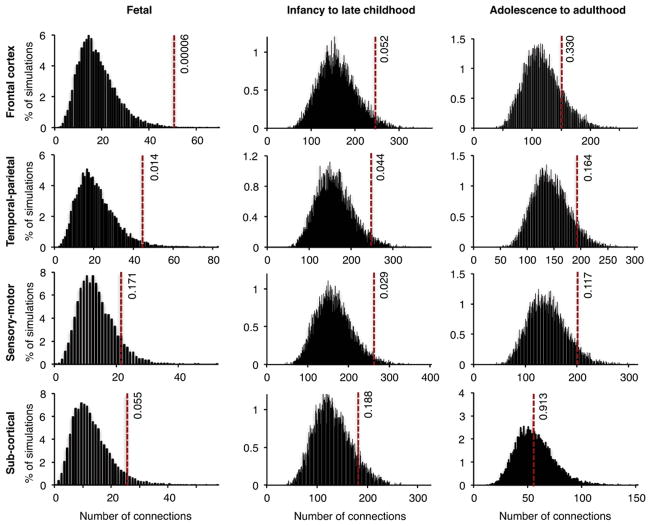
Figure 3. Interconnectedness of transcriptional co-expression networks, at various developmental stages and in different brain regions, based on genes harboring de novo damaging mutations.
Co-expression of genes harboring de novo damaging mutations in cases and in controls was evaluated using RNASeq data from the BrainSpan Atlas. Gene pairs were defined as co-expressed if |R| > 0.8 for their RNASeq expression levels across all tissues from a given brain region and a given developmental stage. Networks were created for co-expressed gene pairs as described for Figure 2B. Dotted lines indicate numbers of connections (edges) in networks created using genes with de novo damaging mutations in cases. Histograms represent distributions of the numbers of edges in 10,000 simulated networks using genes with de novo damaging mutations in controls. The most significant enrichment for co-expression of genes mutant in schizophrenia was observed in frontal cortex during fetal development (P=0.00006; Table S6). There was no enrichment for co-expression of genes with de novo benign mutations in schizophrenia compared to controls (Figure S2).

