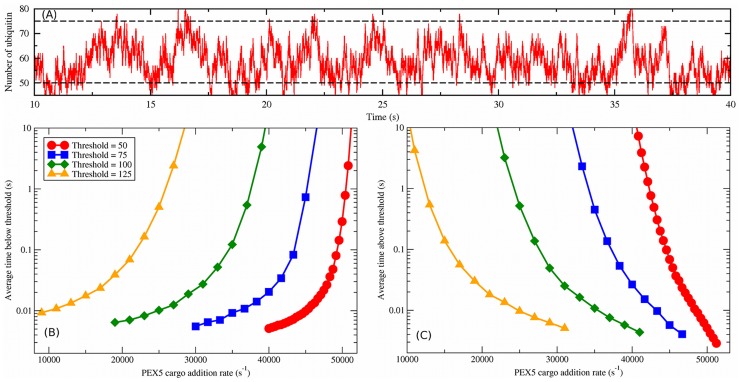
Figure 5. Ubiquitin thresholds for cooperative coupling.
(A) Example time dependence of total peroxisomal ubiquitin for cargo addition rate  , with the default number of peroxisomes (
 ) and importomers per peroxisome (
 ). The characteristic timescale for fluctuations in the ubiquitination level is several seconds. Two possible threshold values are illustrated with dashed lines. (B) The average interval of time spent below a given threshold vs.
  for thresholds as indicated by the legend, which also applies to (C). (C) The average interval of time spent above a given threshold vs.
  .
.

