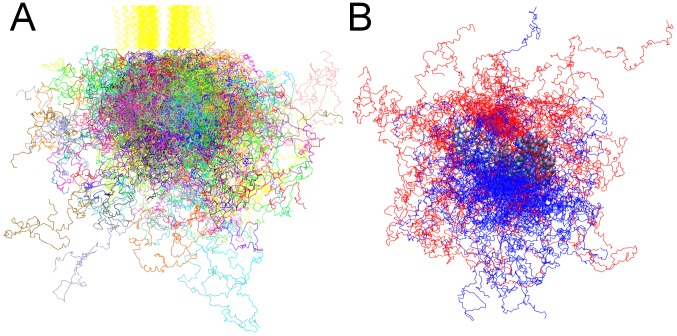
Figure 3. Conformation of the CT domains in randomized dimeric EGFR structural models.
(A) Rendering of fifty randomized structures of the coarse-grained EGFR model showing the backbone conformation of the intracellular (in a different color for each structure) and TM (all in yellow) domains, with the TM domains of each structure together aligned. (B) Graphic of the same structures with the active conformation kinase domain of the receiver molecule in each aligned, the CT domains of the receiver (residues 968 to 1186) and activator (residues 960 to 1186) molecules colored in blue and red, respectively, and pseudo-atoms of the receiver (residues 679 to 967) and activator (residues 679 to 959) kinase domains depicted as ice-blue and white beads, respectively.

