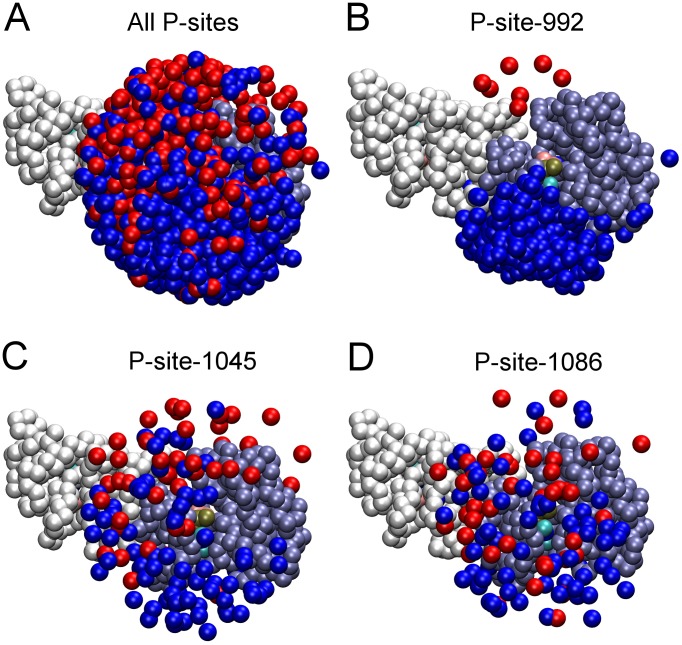
Figure 5. Proximity of P-site tyrosine residues to the catalytic site in randomized EGFR structural models.
Renderings of the five hundred randomized structures used as initial structures in simulations after alignment of their receiver kinase domains are shown. Pseudo-atoms of one receiver (residues 679 to 967) and one activator (residues 679 to 959) kinase domain are depicted as ice-blue and white beads, respectively, and those representing P-site tyrosines in the CT domains of receiver and activator molecules depicted as blue and red beads, respectively. (A) Shown are those pseudo-atoms of all P-site tyrosine residues within 40 Å of the γ-phosphate of the AMPPMP substrate (tan bead) bound in the catalytic site of the receiver molecule. (B–D) Similar renderings but with only the tyrosines of P-site-992 (B), -1045 (C) or -1086 (D) shown. Note an apparent bias in the access of P-site-922 of the receiver molecule to the catalytic site. The number of P-sites of each variety in the vicinity of the catalytic site is quantified in Fig. 6.

