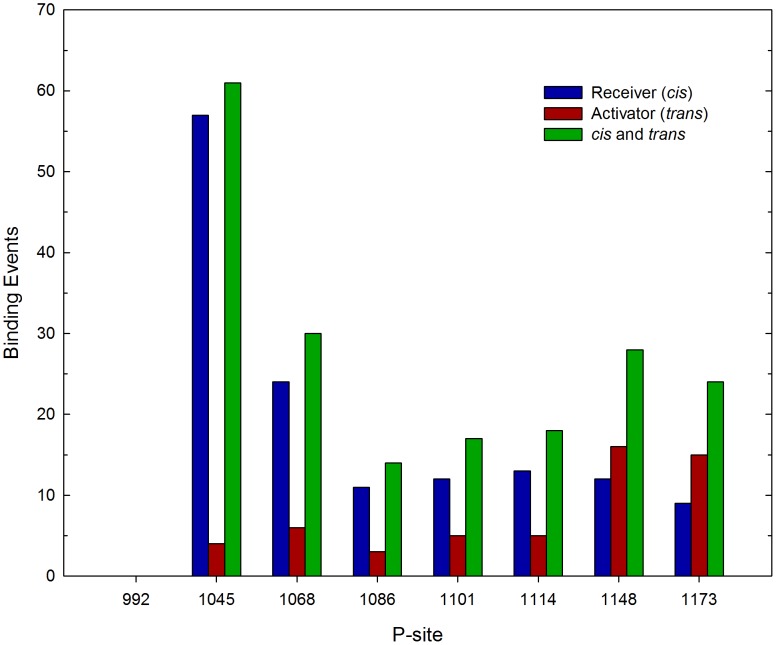
Figure 10. Second P-site binding event following an initial binding of P-site-992A.
Repeated simulations were initiated with structures representing the dimeric EGFR with P-site-992A of the receiver monomer bound in the catalytic site (see Fig. 8B), and with the nascent phosphorylation of P-site-992A mimicked by the introduction of a negative charge and the removal of its P-site/active site interaction potentials in the simulation model (see text). Shown here are the frequencies with which individual P-sites underwent a subsequent P-site binding event over a course of 192 total simulations. A notable bias in favor of cis (Receiver, n = 138) versus trans (Activator, n = 54) binding events was seen, with the sites closest in sequence to P-site-992 of the receiver molecule binding most frequently.

