
Figure 1. Identification of the NELF-E Binding Element within high affinity aptamers.
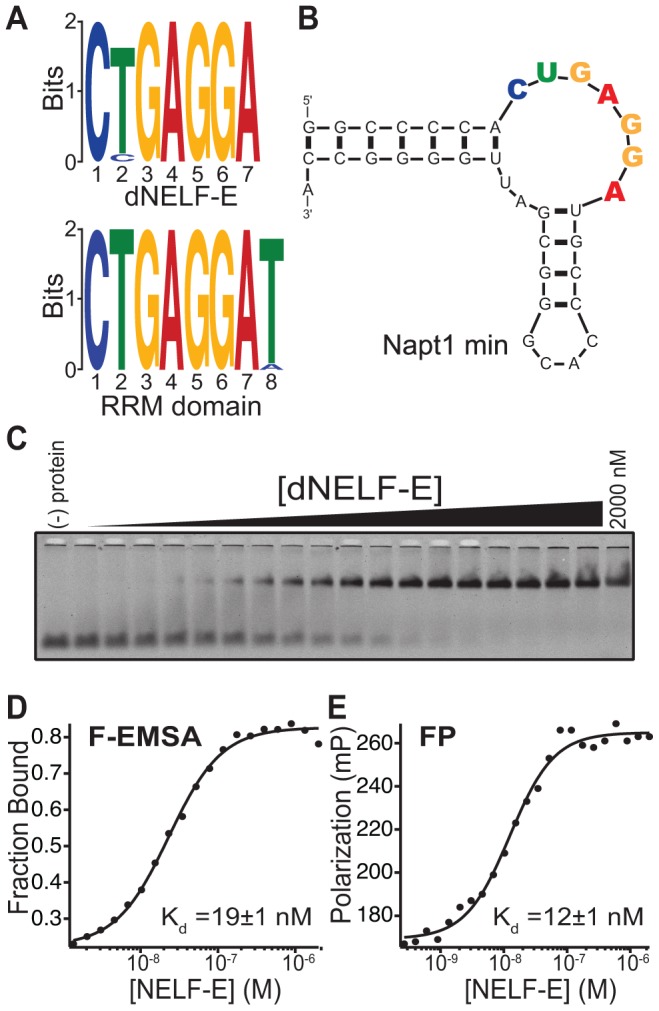
(a) MEME analysis of the top 3,000 unique clustered sequencing reads from a SELEX experiment of dNELF-E or its RRM domain. The sequence logo derived is shown for both proteins. (b) Secondary structure of Napt1min RNA aptamer. An additional GC base pair was added to the end of the aptamer (see Materials and Methods). The consensus sequence is highlighted with coloring that corresponds to the sequence logo. (c) Full length dNELF-E binds to Napt1min with high affinity. Shown is a representative fluorescence electrophoretic mobility shift assay (F-EMSA) with increasing concentrations of dNELF-E protein from 1.4 nM up to 2 µM and a fixed concentration of fluorescently labeled aptamer. (d) A plot of the fraction of bound Napt1min against protein concentration is presented for the gel in panel (c) and fit to the Hill equation. The equilibrium dissociation constant (Kd) is shown in the graph and the error represents the standard deviation of the uncertainty of the fit. (e) A plot of fluorescence polarization of the same binding experiment and its measured Kd and fit error are presented. Raw polarization values are given in units of milipolarization (mP).