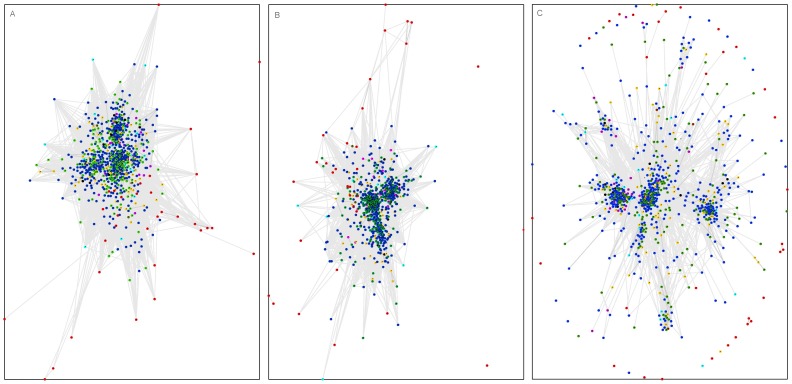
Figure 4. CLANS graph – sequence similarity-based clustering of bacterial annexins and known eukaryotic annexins.
A) very relaxed sequence similarity threshold, B) relaxed sequence similarity threshold, C) strict sequence similarity threshold. Symbols colouring by taxonomy: red – Bacteria, blue - Metazoa, orange - Fungi, cyan - other Opisthokonts, green - plants, magenta - Stramenopiles, brown - Excavata, black - Amoebozoa. 774 representative sequences included The P-value sequence similarity thresholds used for graph building: A) 0.1, B) 1e-3, C) 1e-7.

