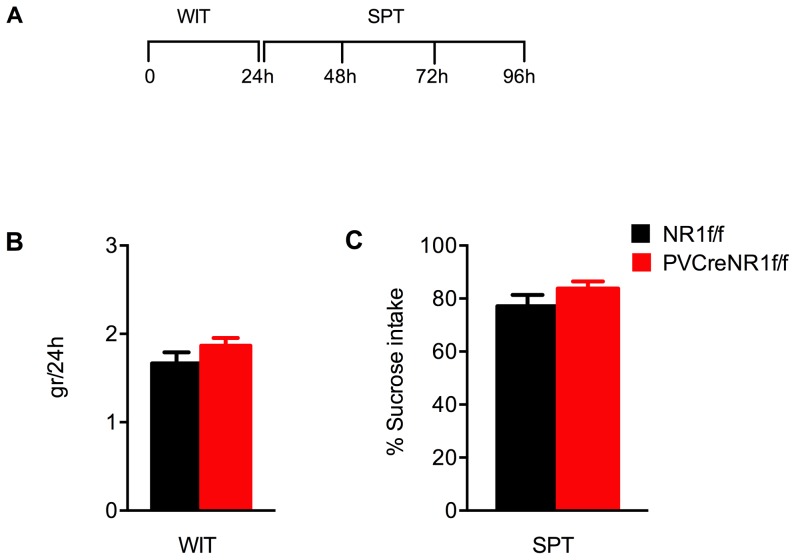
Figure 6. Sucrose preference test in animals lacking NMDAR in PV neurons.
(A) Outline of the water intake and the sucrose preference test in PV-Cre+/NR1f/f and NR1f/f mice. (B) Water intake test (WIT) in mice lacking NMDAR specifically in PV neurons (PV-Cre+/NR1f/f, red bars, n = 9) compared with control mice (NR1f/f, black bars, n = 6). WIT was run for 24 h. Results (gr) are presented as mean values ±SEM (p>0,05;Student's t-test). (C) Sucrose preference test (SPT) in mice lacking NMDAR specifically in PV neurons (PV-Cre+/NR1f/f, red bars, n = 9) compared with control mice (NR1f/f, black bars, n = 6). SPT was run for 72 h. Results (sucrose intake/total intake ×100) are presented as mean values ±SEM (p>0,05;Student's t-test). Both genotypes display similar behavioral response.

