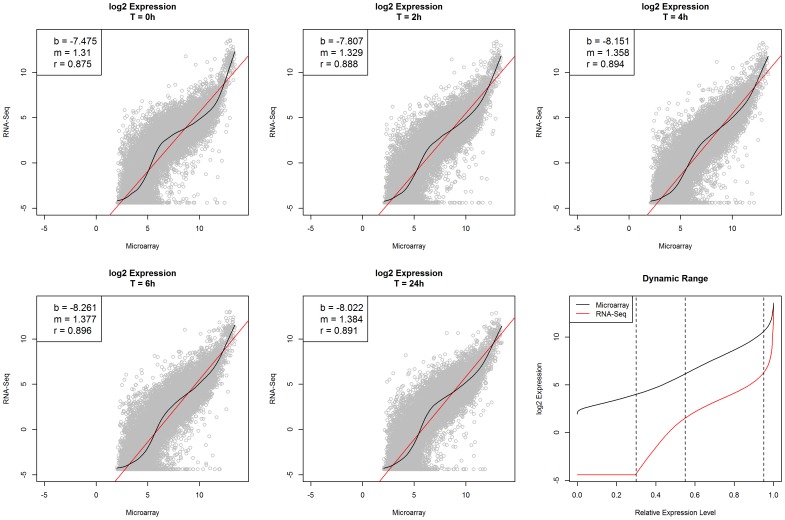
Figure 2. Comparison of expression profiles of 18,306 common genes between both platforms.
Scatter plots show the averages (between biological duplicates) of log2 transformed expression values between two platforms, at each individual time point. The relationship between the expression profiles generated in both platforms is depicted as either a smoothing spline (black) or a linear regression line (red). The intercept (b) and the slope (m) of the linear regression line, and the correlation coefficient (r) are reported at the top-left corner in each plot corresponding to each time point. The plots show that the overall dynamic range of the 18,306 common genes generated by the two platforms is much broader in RNA-Seq (2.6×10⁵) than in microarray (3.6×10³). Similar dynamic ranges are displayed in both platforms for genes with relative expression level between 0.55 and 0.95. In each platform, the relative expression level of each gene was determined based on the average of log2 transformed expression values in all 12 samples.

