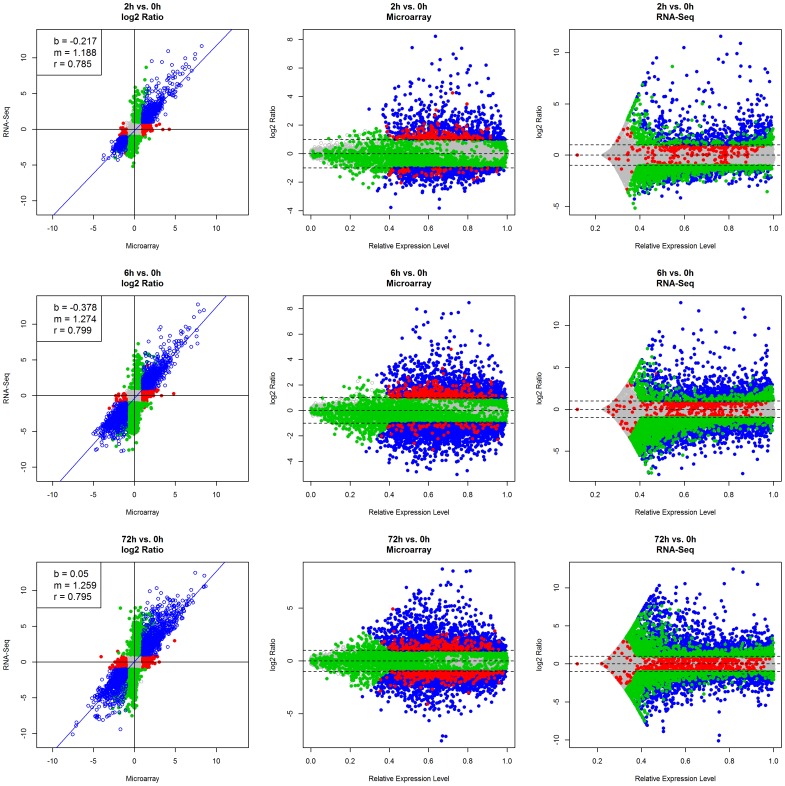
Figure 4. Comparing differential expression profiles of 18,306 common genes between microarray and RNA-Seq.
Scatter plots of log2 transformed ratios (vs. baseline at T = 0 h) between both platforms at selected time points (T = 2, 6, and 72 hour) show similar results are observed at T = 4 and 24 hour. Genes that are specifically differentially expressed in microarray or RNA-Seq are colored in red and green respectively, and genes that are differentially expressed in both platforms are colored in blue.

