
Figure 2. US expectancy ratings.
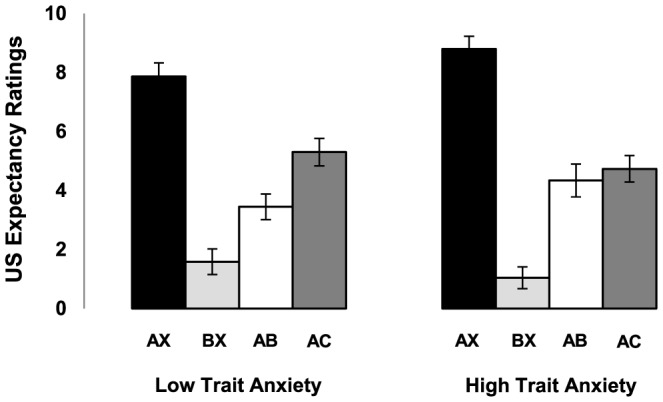
Expectancy of the unconditioned stimulus to the last AX and BX trial as well as the first AB and AC trial for the low trait anxiety and high trait anxiety group. Error bars represent SEM.
Official websites use .gov
A
.gov website belongs to an official
government organization in the United States.
Secure .gov websites use HTTPS
A lock (
) or https:// means you've safely
connected to the .gov website. Share sensitive
information only on official, secure websites.
Expectancy of the unconditioned stimulus to the last AX and BX trial as well as the first AB and AC trial for the low trait anxiety and high trait anxiety group. Error bars represent SEM.