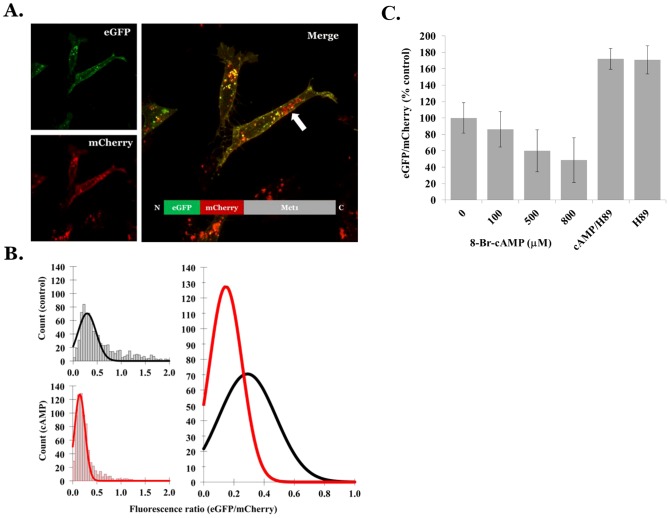
Figure 7. cAMP dependent acidification of dual tagged Mct1 vesicles.
A. A confocal micrograph of EGFP-mCherry-Mct1, showing individual EGFP (green) and mCherry (red) color channels from a single plane on the left and the merged image on the right. The inset on the right diagrams the protein product of the expression construct. The arrow indicates a cluster of Mct1 vesicles that appear red because of selective quenching of the EGFP signal in more acidic endosomes. B. Histograms showing the distributions of the EGFP/mCherry intensity ratios in vesicles from control (n = 7 cells, 828 vesicles, upper left) and 500 µM 8Br-cAMP treated cells (7 cells, 748 vesicles, lower left) and curves fit with the Gaussian equation described in the text. The curves are shown superimposed in the right panel for comparison of results between control (black) and 8Br-cAMP treated cells (red). C. Dose response showing the effect of 8Br-cAMP on control-normalized EGFP/mCherry intensity ratios measured 30 minutes after treatment. In the H89 groups, 20 µM H89 was present for 10 minutes with or without 500 µM 8Br-cAMP (n = 6 cells with >200 vesicles per group). The experiment was repeated with similar results.

