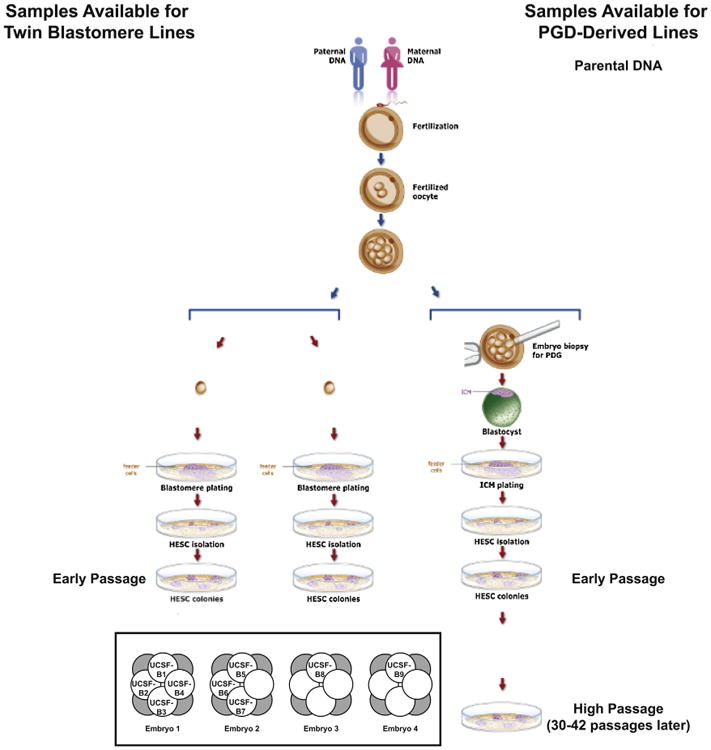
Figure 1. hESC Lines and Parental DNA Samples Used in This Study.

Schematic diagram summarizing the samples collected for analysis relating to the PGD-derived hESC lines. (inset) Diagram showing relationships among the nine twin blastomere (UCSF-B) hESC lines. Embryos 1, 2, 3, and 4 are dyzygotic twins; UCSF-B1, -B2, -B3, and -B4, as well as UCSF-B5, -B6, and -B7 are monozygotic twin lines. See also Figures S4, S5, and Table S1.
