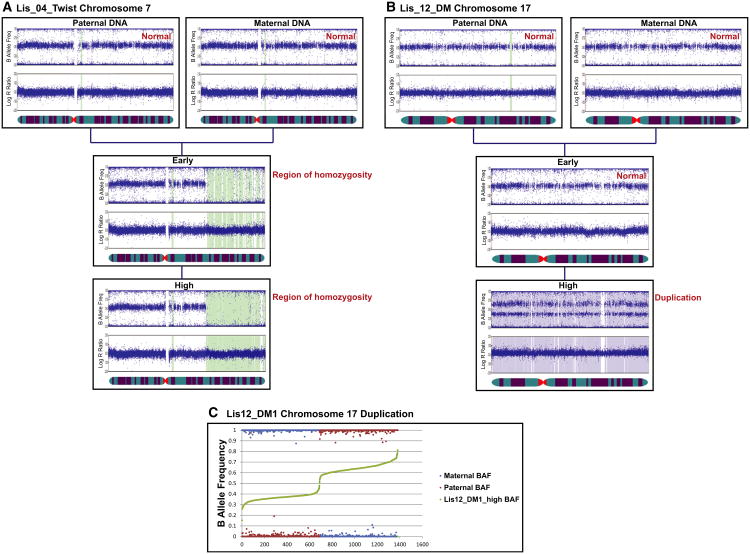
Figure 3. Representative BAF and LogR Ratio Plots.
(A and B) Data illustrating a region of homozygosity on chromosome 7 in the early and high-passage samples of the Lis04_Twist hESC line (A) and a duplication of chromosome 17 in the high-passage sample of the Lis12_DM hESC line (B).
(C) B allele frequency data analysis showing the paternal origin of the duplicated chromosome 17 in the high-passage Lis12_DM1 culture.

