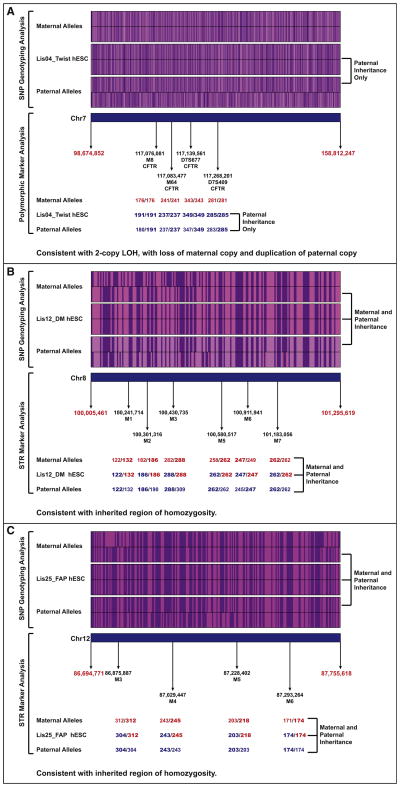
Figure 4. SNP Genotyping and STR Marker Analysis Data for Regions of Homozygosity.
For the SNP genotyping analysis, the A alleles are shown in purple, and the B alleles in pink. For the STR analyses, the amplicon sizes (numbers of repeats) for each repeat sequence are shown. Maternal alleles are shown in red, paternal alleles are blue, and the parental allele(s) of origin are indicated in bold typeface.
(A) Lis04_Twist, chr7.
(B) Lis12_DM, chr8.
(C) Lis25_FAP, chr12.

