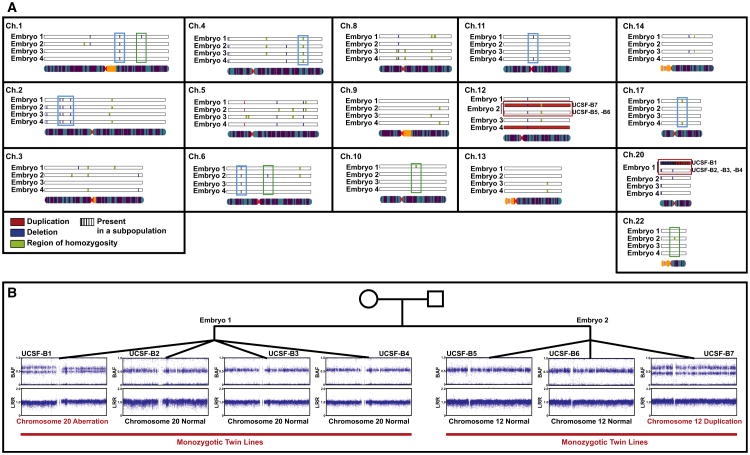
Figure 5. CNVs Identified Using SNP Genotyping in the Twin Blastomere Lines.
(A) Summary of CNVs called in the twin blastomere lines. If a given variant was present in all of the lines derived from the same embryo, they are displayed together. In cases in which there was a discrepancy among the lines derived from the same embryo, all variants are shown. Duplications are shown in red, deletions in blue, regions of homozygosity in green, and an indeterminate region (either duplication or deletion, present in a subpopulation of cells) in purple. Examples of variants present in two or more embryos are in aqua boxes, examples of variants present in all lines from only one embryo are in green boxes, and the two aberrations that are found in only one of multiple lines from a given embryo are in the red boxes. Only chromosomes for which at least one variant was detected are shown.
(B) Representative BAF and LogR Ratio plots illustrating the chromosome 20 aberration in one line from Embryo 1 and the chromosome 12 duplication in one line from Embryo 2.

