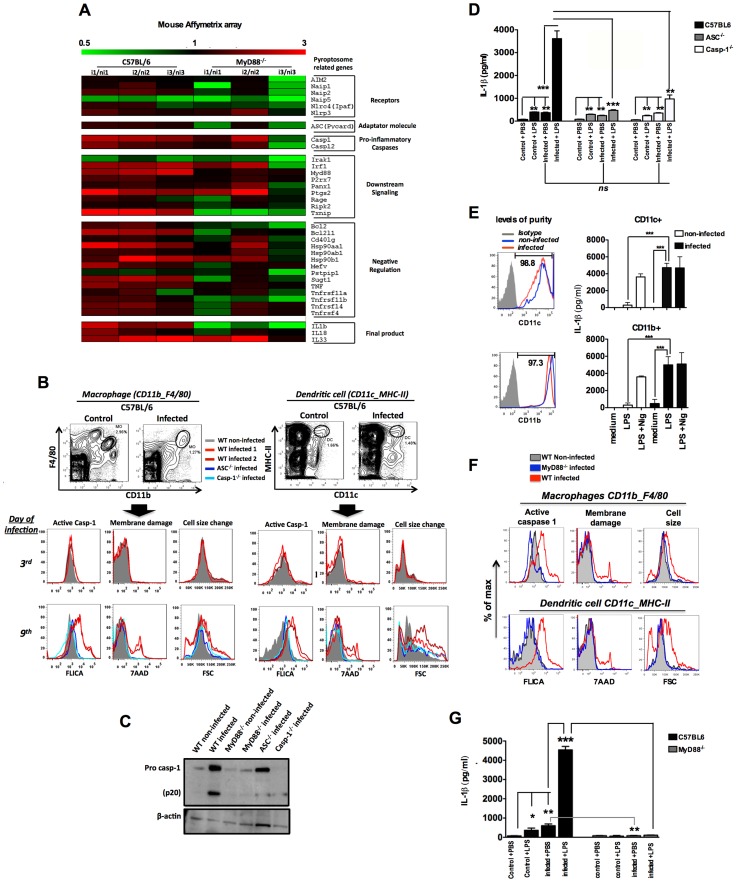
Figure 1. Caspase-1 activation, IL-1β production and pyroptosis in splenic macrophages and DCs from P. chabaudi infected mice.
(A) Gene expression was determined in splenocytes of 3 C57BL/6 or MyD88−/− mice at 6 days post-infection over 3 non-infected controls by Microarray analysis. (B and F) Splenocytes from C57BL/6, ASC−/−, Casp-1−/− or MyD88−/− mice were stained and analyzed by FACs to gate macrophages (CD11b+F4/80+) and DCs (CD11c+MHC-II+). Active caspase-1 was evaluated by FLICA reagent, membrane integrity by nuclei staining with 7AAD, and cell size change by shift on FSC axis. The results are representative from 3 experiments that yield similar results. (C) On day 7 post-infection splenocytes from C57BL/6, ASC−/−, Casp-1−/− and MyD88−/− mice were lysed by RIPA buffer and analyzed by Western blot employing an anti-caspase-1 antibody. A faint band of similar molecular weight of active caspase-1 corresponds to IgG light chain is seen in the infected ASC−/− and Casp-1−/− mice. (D and G) At 7 days post-infection mice were inoculated intravenously with 10 µg of LPS per mouse, and 9 hours later, sera was collected for measuring the levels of circulating IL-1β. The average levels of IL-1β in control and infected mice, before LPS challenge, were 64.2 and 434.2 pg/ml in figure D, and 82.2 and 602.4 pg/ml in figure G. These results are the means + SEM of 10–15 animals from 3 independent experiments that yield similar results. (E) CD11c+ and CD11b+ cells highly purified from spleens of C57BL/6 mice at day post-infection were cultured with LPS (1 µg/ml) and supernatants harvested 18 h later to measure the levels of IL-1β. As positive control we used the purified cells stimulated with LPS at same concentration followed by nigericin at 5 µM. Significant differences are indicated by *p<0.01, **p<0.001 and ***p<0.0005 obtained in the Mann-Whitney test.

