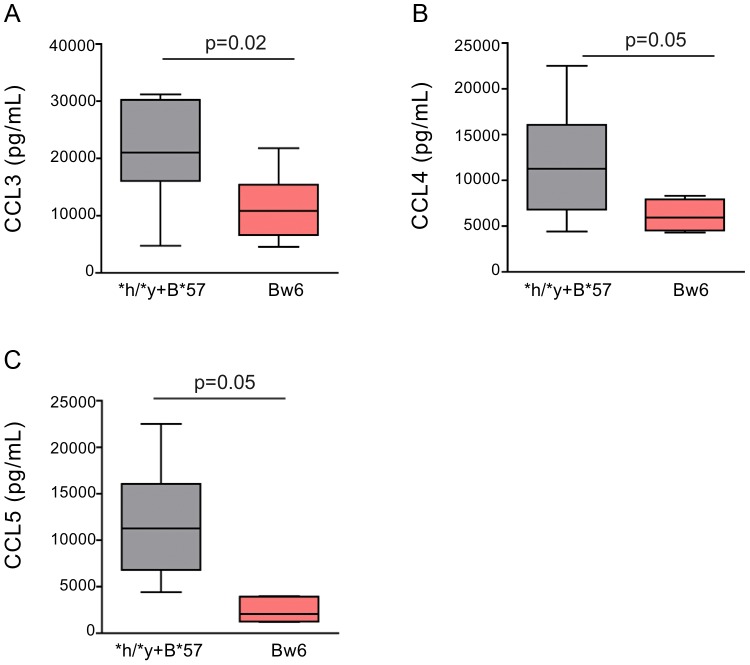
Figure 4. NK cells from subjects positive for *h/*y+B*57 secrete more CC-chemokines in response to autologous HIV infected CD4 (iCD4) cells than those from Bw6hmz.
Box and whisker plots show the levels of CCL3 (A), CCL4 (B) and CCL5 (C) secreted over 3 days into the supernatant of cultures of NK cells and autologous iCD4 cells at a 10∶1 ratio from individuals positive for *h/*y+B*57 (n = 7) or from Bw6hmz (n = 10). The line in each box represents the median value, the lower and upper limits of the boxes the 25% and 75% quartiles and the whiskers the minimum and maximum values for each group. Lines linking groups indicate comparisons where medians were significantly different.

