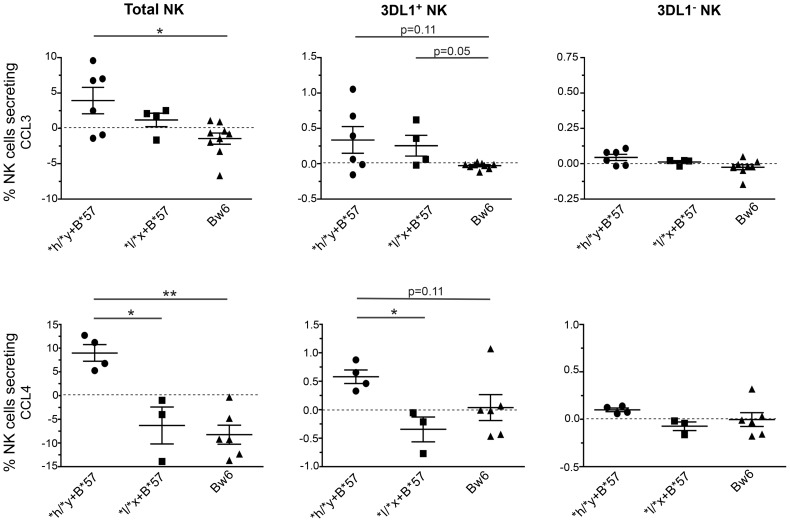
Figure 5. Percent of CCL3+ and CCL4+ NK cells and NK cell subsets following stimulation with autologous HIV infected CD4 (iCD4) cells.
CD4 cells infected with HIV and cultured for 7 days were used to stimulate autologous NK cells for 24+ (upper panels) and CCL4+ (lower panels) total NK cells (left), KIR3DL1+ (middle) and KIR3DL1− (right) NK cell subsets in subjects positive for *h/*y+B*57 (n = 7) *l/*x+B*57 (n = 4) and Bw6hmz (n = 9). Each point represents the value for a single individual, the line and error bars through each group show the mean and the standard error of the mean for each data set. Lines linking groups indicate between-group comparisons. “*” = a p-value<0.05, “**” = a p-value of <0.01.

